
Inventory turn equals Cost of Goods Sold (COGS) ÷ Average Inventory for the same period. That single ratio tells you how many times you sold and replaced your stock. Convert it to days with Days Inventory Outstanding (DIO) = 365 ÷ Inventory turns, per the days-in-inventory formula. One quick caveat before you run the numbers: always use COGS, not net sales. Sales include your markup, which inflates the ratio and makes it incomparable across companies, as Investopedia notes. And if your inventory fluctuates through the year, a simple beginning-plus-ending average can mislead you. More on both points below.
Key Takeaways
Inventory turn calculation is most reliable when you use COGS (not sales), align your numerator and denominator to the same period, and average inventory across multiple snapshots rather than just two points.
| Point | Details |
|---|---|
| Use COGS, not net sales | Net sales inflate the ratio by including markup; COGS keeps the calculation comparable. |
| Align periods precisely | Annual COGS must pair with an annual average inventory, not a single month-end balance. |
| Convert turns to DIO | Divide 365 by your turns to get days of cash tied up; use this for cash-flow planning. |
| Benchmark by industry | Automotive dealers target a moderate to high number of turns per year; comparing to grocery or apparel is meaningless. |
| Loturn for dealers | Loturn assigns exact COGS per vehicle, so turn calculations reflect real costs, not estimates. |
Table of Contents
- What inventory turnover actually measures
- Breaking down every variable in the formula
- Step-by-step worked examples with two scenarios
- How to calculate inventory turns in Excel
- What counts as a good inventory turn ratio?
- Common pitfalls that distort your inventory turn rate
- Using inventory turns to drive purchasing and pricing decisions
- Inventory turns for independent used-vehicle dealers
- Why frequent averaging and per-unit costing matter most
- Loturn tracks every cost so your turns are always accurate
- Sources
- FAQ
What inventory turnover actually measures
Inventory turnover tells you how liquid your stock is. A turn of 6 means you cycled through your entire inventory six times in a year. A turn of 1.5 means stock sat for most of the year before it moved.
The metric answers three practical questions at once:
- How much working capital is tied up in stock? Higher turns mean cash cycles back faster.
- Are you buying too much or too little? Turns that are too low signal excess stock; turns that are too high can signal stockouts.
- How efficient is your purchasing? Consistent turns across periods show disciplined buying.
When to calculate: monthly turns work well for fast-moving goods or when you need to catch problems early. Quarterly turns smooth out short-term noise. Annual turns are standard for financial reporting and lender conversations. For lumpy, high-value inventory like vehicles, DIO is often the more actionable view because it translates the ratio directly into days of cash tied up.
Breaking down every variable in the formula
COGS: where to find it and what to include
COGS comes from your income statement. For a retailer or dealer, it includes the purchase cost of goods sold, plus any direct costs to get the item ready for sale: freight in, recon, and prep. It excludes operating expenses like rent, salaries, and marketing.
What to leave out: selling, general, and administrative expenses (SG&A), depreciation on facilities, and interest expense. Mixing those in overstates COGS and understates your turns.
Average inventory
The standard formula is (Beginning Inventory + Ending Inventory) ÷ 2. That works fine when inventory is relatively stable. When stock swings significantly across months, a two-point average can hide the real picture. BDC recommends averaging monthly or quarterly snapshots for businesses with lumpy or seasonal inventory, which is exactly the situation most used-vehicle dealers face.
Period alignment
The numerator (COGS) and denominator (average inventory) must cover the same period. Annual COGS divided by a single month-end inventory balance produces a meaningless number. Match them: annual COGS with an annual average, quarterly COGS with a quarterly average.
The alternative formula and why it matters
Some analysts use Net Sales ÷ Average Inventory when COGS is unavailable. US Finance Calculators confirms this is the secondary method: it produces higher, noncomparable ratios because sales include margin. Accountants and lenders prefer the GAAP method. If you’re benchmarking against industry data, confirm which formula that data used before drawing conclusions.
Pro Tip: If you’re pulling COGS from QuickBooks or another general ledger, double-check that vehicle acquisition costs, recon, and transport are coded to COGS, not to operating expenses. Miscoded costs are the most common reason dealer turns look artificially high.
Step-by-step worked examples with two scenarios
Here’s how to run the full inventory turn calculation from raw inputs to DIO.
Inputs for both scenarios:
| Input | Scenario A (Slow Turn) | Scenario B (Fast Turn) |
|---|---|---|
| Beginning inventory | $240,000 | $120,000 |
| Ending inventory | $200,000 | $100,000 |
| COGS for the period | $220,000 | $220,000 |
Steps:
- Calculate average inventory. Scenario A: ($240,000 + $200,000) ÷ 2 = $220,000. Scenario B: ($120,000 + $100,000) ÷ 2 = $110,000.
- Calculate inventory turns. Scenario A: $220,000 ÷ $220,000 = 1.0 turn. Scenario B: $220,000 ÷ $110,000 = 2.0 turns.
- Convert to DIO. Scenario A: 365 ÷ 1.0 = 365 days. Scenario B: 365 ÷ 2.0 = 182.5 days.
Outputs:
| Output | Scenario A | Scenario B |
|---|---|---|
| Average inventory | $220,000 | $110,000 |
| Inventory turns | 1.0 | 2.0 |
| Days Inventory Outstanding | 365 days | 182.5 days |
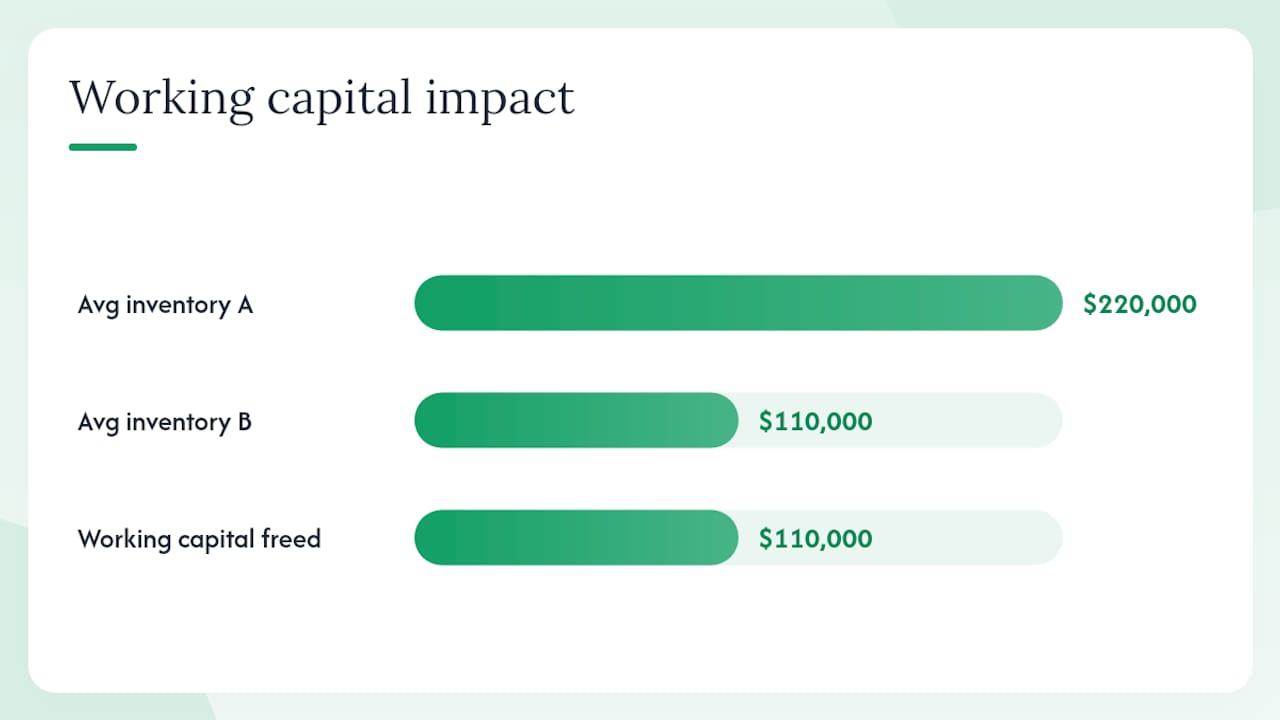
The cash implication is direct. In Scenario A, your money sits in inventory for a full year on average. In Scenario B, it cycles back in roughly six months. Same COGS, same revenue potential, but Scenario B frees up $110,000 in working capital. That difference shows up in your ability to buy more vehicles, service debt, or cover operating costs without a credit line.
How to calculate inventory turns in Excel
You don’t need a separate tool. These formulas work in any standard Excel or Google Sheets setup.
- Set up your data. Put Beginning Inventory in B2, Ending Inventory in B3, and COGS in B4.
- Average inventory formula:
=(B2+B3)/2in cell B5. - Inventory turns formula:
=B4/B5in cell B6. - DIO formula:
=365/B6in cell B7. - For multi-month averaging: If you have monthly inventory snapshots in cells C2:N2 (12 months), use
=AVERAGE(C2:N2)as your average inventory. Then divide COGS by that average for a more accurate annual turn. - For a multi-SKU or multi-vehicle table: Set up one row per vehicle or SKU with columns for beginning cost, ending cost, and COGS. Add a turns column with
=D2/((B2+C2)/2)and a DIO column with=365/E2. Select the whole table and insert a PivotTable to group by category, lot, or month.
Pro Tip: Lock your COGS cell with an absolute reference ($B$4) when copying the turns formula across rows. A relative reference will shift the COGS row down with each copy, pulling from the wrong cell and silently breaking every calculation below it.
What counts as a good inventory turn ratio?
“Good” is entirely relative to your industry. A grocery chain turning inventory 15–20 times per year would be alarmed by a ratio of 2. A jewelry retailer hitting 2 turns is doing fine.
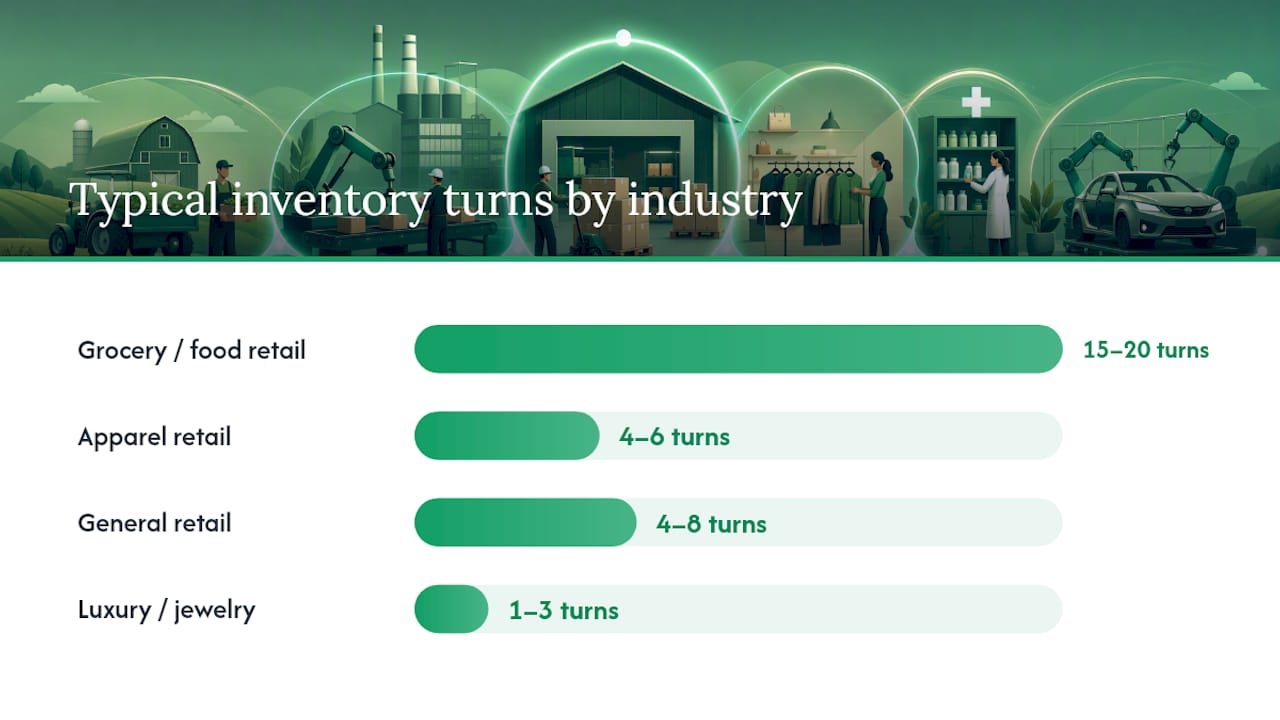
Benchmark ranges vary widely by sector:
| Industry | Typical turns per year | Approximate DIO |
|---|---|---|
| Grocery / food retail | 15–20 | 18–24 days |
| Apparel retail | 4–6 | 60–90 days |
| General retail | 4–8 | 45–90 days |
| Automotive dealers | a moderate to high range | a moderate to low range of days |
| Luxury / jewelry | 1–3 | 120–365 days |
A few things to keep in mind when reading these ranges:
- Higher isn’t always better. Turns above your industry norm can mean you’re running too lean, risking stockouts and lost sales.
- Lower signals excess. Stock sitting too long ties up cash, accumulates carrying costs, and often forces markdowns later.
- Translate turns into a DIO target for cash planning. If your lender wants inventory cycling every 45 days, that’s a turns target of roughly 8 per year (365 ÷ 45).
- Benchmark against your own segment. Industry-specific benchmarking is the only meaningful comparison; comparing a used-car lot to a hardware store tells you nothing useful.
Common pitfalls that distort your inventory turn rate
Getting the formula right is step one. Getting the inputs right is where most calculations go wrong.
- Using net sales instead of COGS. This inflates turns by including your gross margin in the numerator. The GAAP-preferred method is COGS ÷ Average Inventory. Always.
- Two-point averaging on seasonal inventory. If you stock up in Q3 and sell down in Q4, beginning-plus-ending divided by two understates your average on-hand balance and overstates turns.
- Ignoring consignment and floorplan units. Vehicles on consignment or financed through a floorplan line may appear in your inventory count but shouldn’t be in your owned-inventory average unless you’ve actually taken title and cost.
- Inventory valuation method mismatches. FIFO, LIFO, and weighted-average cost produce different COGS figures for the same physical goods. Switching methods mid-year or comparing to a peer using a different method makes the ratio meaningless.
- Inventory write-downs and obsolete stock. A write-down reduces the inventory balance immediately, which mechanically increases your turns ratio even though no sale occurred. Flag any period with significant write-downs before citing the ratio to a lender or partner.
- Period misalignment. Annual COGS with a single quarter-end inventory snapshot is a common spreadsheet error. Always confirm the period covered by each input before dividing.
- Returns and credits. Returned goods add back to inventory but may not reduce COGS cleanly depending on how your system handles them. Reconcile returns before finalizing the calculation.
Using inventory turns to drive purchasing and pricing decisions
A calculated turn ratio is only useful if it changes a decision. Here’s how to put the number to work:
- Reorder cadence. If your DIO is 90 days, you need to reorder roughly every 90 days to maintain current stock levels. Shorten DIO and you can reorder more frequently in smaller batches, reducing carrying risk.
- Markdown triggers. Set a DIO threshold per category. Any unit sitting beyond that threshold automatically enters a pricing review. For dealers, a vehicle past 60 days on lot is a common trigger for a price reduction.
- Safety stock adjustments. Higher turns with consistent demand justify leaner safety stock. Erratic turns with unpredictable demand require a larger buffer.
- Supplier negotiation timing. When turns are strong, you have leverage: you’re moving product fast and can negotiate better terms or volume pricing. When turns are weak, fix the inventory problem before renegotiating, or you’ll commit to volume you can’t move.
- Working capital and bank financing. Every day of DIO is one more day of working capital tied up in inventory. Reducing DIO by 15 days on a $500,000 average inventory frees $20,500 in cash (500,000 ÷ 365 × 15). That’s real money for payroll, acquisitions, or debt service.
Pro Tip: Build a simple monthly dashboard: turns, DIO, and average days-on-lot per vehicle category. Review it the first week of each month. Patterns across three or four months tell you far more than any single period’s ratio.
Inventory turns for independent used-vehicle dealers
Used-vehicle dealers face a calculation challenge that most retail businesses don’t: each unit is unique, high-value, and carries a different cost basis. A standard two-point annual average can mask the real picture entirely.
- Use monthly averaging. Pull your inventory balance at the end of each month and average all 12 values for an annual turn. For quarterly turns, average the three month-end balances within that quarter. This approach, recommended for lumpy inventories, smooths out the distortion caused by buying a batch of vehicles in one month and selling them the next.
- Build COGS per vehicle. Your true COGS per vehicle includes the purchase price, transport to your lot, all recon and prep costs, and any fees paid at auction. Leaving out recon understates COGS and overstates your gross, which then understates turns.
- Treat floorplan interest carefully. Floorplan interest is a financing cost, not a product cost, so it typically sits below the gross profit line. However, for cash-flow planning purposes, it’s worth tracking separately per vehicle so you know the true cost of holding a unit past its optimal sell window.
- Fields to capture per vehicle: purchase price, auction or transport fees, recon costs, days on lot, sale price, and any floorplan interest accrued. With those fields populated, you can calculate per-car turns and DIO at the individual unit level, not just the lot average.
- Benchmark against independent dealers, not franchises. Used-vehicle dealers operate with different cost structures than new-car franchises. A turn rate that looks low against a franchise benchmark may be perfectly normal for an independent lot with a different mix and price point.
Loturn’s per-car profit tracking assigns every cost to the individual vehicle, so your COGS figure for each unit is exact rather than estimated. That precision flows directly into more accurate turn calculations across your whole inventory management view.
Why frequent averaging and per-unit costing matter most
Most guides on inventory turn calculation spend their time on the formula and skip past the averaging question. That’s the wrong priority. The formula is simple arithmetic. The averaging method is where the analysis either holds up or falls apart.
A dealer who buys 20 vehicles in January and sells 18 by March will show a wildly different turn depending on whether they use a two-point annual average or a monthly average. The monthly average captures the January spike in inventory; the two-point average misses it entirely and produces a ratio that looks better than reality. That misleading signal then flows into purchasing decisions, pricing reviews, and lender conversations.
Per-unit costing compounds this. When recon costs are pooled at the lot level rather than assigned to individual vehicles, you lose the ability to see which units are actually profitable and which are eating margin. A vehicle with $3,000 in recon on a $12,000 purchase is a fundamentally different investment than one with $300 in recon on the same purchase price. Treating them identically in your COGS calculation hides that difference.
Loturn tracks every cost so your turns are always accurate
Independent dealers who calculate turns manually often discover the hard work isn’t the formula. It’s gathering clean, complete cost data for every vehicle before running the numbers.

Loturn is built specifically for that problem. The platform assigns purchase price, transport, recon, and prep costs to each individual vehicle automatically, giving you exact COGS per unit rather than lot-level estimates. Its dealer accounting features use a native automotive chart of accounts, so floorplan interest, recon, and acquisition costs land in the right buckets from day one. Data is protected with bank-level encryption, and Loturn’s team handles free data migration to get you set up without rebuilding records from scratch. If you want turns and per-car profitability you can actually trust, see how Loturn works and start a free trial.
Sources
- Inventory Turnover Ratio: What It Is, How It Works, and Formula
- Inventory turnover - Formula, Calculation & Examples
- Inventory turnover ratio calculator
- Inventory Turnover Ratio and DIO calculator
- Days in inventory
FAQ
How do you calculate inventory turns?
Divide COGS by average inventory for the same period: Inventory turns = COGS ÷ ((Beginning Inventory + Ending Inventory) ÷ 2). Use COGS, not net sales, to keep the ratio comparable across businesses.
What does an inventory turn of 1.5 mean?
A turn of 1.5 means you sold and replaced your entire inventory 1.5 times during the period, which translates to roughly 243 days of inventory on hand (365 ÷ 1.5). For most industries, that signals excess stock or slow-moving product.
What is a good inventory turn ratio?
It depends entirely on your industry. Automotive dealers typically target 6–12 turns per year; general retailers often fall in the 4–8 range. Comparing your ratio to a different industry’s benchmark produces a misleading conclusion.
How do you calculate inventory turns in Excel?
With beginning inventory in B2, ending inventory in B3, and COGS in B4, use =B4/((B2+B3)/2) for turns and =365/(B4/((B2+B3)/2)) for DIO. For a 12-month average, replace the two-point average with =AVERAGE(C2:N2) across monthly snapshots.