
Run a weekly per-vehicle P&L that combines your purchase cost, every attached expense, floorplan interest, and a slice of allocated overhead. That single number, computed weekly, is what separates dealers who know their margin from dealers who guess it.
Why weekly and not monthly? Month-end reporting tells you what happened. A weekly snapshot tells you what to do about it before a slow-turning unit costs you another $200 in floorplan interest. The difference matters most when you’re deciding whether to drop a price, push a unit to wholesale, or hold for retail.
To get started this week, pull three data sources:
- Purchase records (your buy sheet or DMS acquisition entry for every unit on lot)
- Recon invoices (shop tickets, parts receipts, and any sublet work tagged to a VIN)
- Floorplan statements (your floor plan lender’s per-unit daily interest charges)
Those three alone will surface most of the margin leakage hiding in your inventory right now.
Key Takeaways
Accurate per-car profit tracking requires combining purchase cost, all attached expenses, floorplan interest, and allocated overhead into a weekly per-vehicle P&L reviewed every Friday.
| Point | Details |
|---|---|
| Front-end gross ≠ net profit | True net profit subtracts recon, floorplan interest, advertising, and commission from front-end gross. |
| Weekly cadence is the operational lever | A weekly per-car P&L surfaces slow-turning and negative-net units before floorplan interest compounds. |
| Benchmark targets for independents | Target $1,200 to $2,000 front-end gross and 30–45 days-to-turn; recon above 10% of purchase price signals a problem. |
| Three reconciliation sources to pull now | Purchase records, recon invoices, and floorplan statements cover the majority of per-unit cost gaps. |
| Loturn for implementation | Loturn assigns costs at the VIN level, tracks floorplan interest, and integrates with dealer accounting in one platform. |
Table of Contents
- What does “per-car profit” actually include?
- How do you calculate per-car profit?
- Where do the numbers come from?
- When should you run per-car profit reports?
- Common mistakes that hide or distort per-car profit
- What does “good” look like for independent used-car dealers?
- Spreadsheets vs. dealer platforms: which fits your lot?
- How to set up per-car profit tracking in 30/60/90 days
- Why real-time per-car P&L matters more than dealers expect
- Loturn gives you accurate per-car profit without the spreadsheet chaos
- Sources
- FAQ
What does “per-car profit” actually include?
Most dealers know their front-end gross: selling price minus what they paid at auction. That number is real, but it’s not profit. VantaInsights notes that dealership net profit margins sit in the low single digits precisely because operating costs consume the gap between front-end gross and what actually stays in the account.
Here’s every cost layer that belongs in a true per-vehicle P&L:
- Acquisition/purchase price — the buy price, including any buyer’s premium
- Auction and broker fees — lane fees, gate fees, arbitration charges
- Transport — transport invoices from auction to lot, or dealer-to-dealer transfers
- Recon: parts and labor — shop tickets, sublet invoices, tires, detail
- Inspection fees — state safety inspection, emissions, or pre-sale certification costs
- Dealer-installed accessories — window tint, floor mats, remote start (cost, not retail)
- Advertising and listing fees — your pro-rated share of digital ad spend, lot signage, and third-party listing fees tied to that unit
- Lot fees and insurance — dealer lot insurance allocated per unit, storage fees
- Sales commission — the flat or percentage commission paid on the deal
- Taxes, title, and licensing — any dealer-paid T&L costs not passed to the buyer
- Floorplan interest — daily interest rate × days held × floored amount
- Warranty reserves and F&I allocations — dealer cost of any warranty sold, chargebacks reserved
- Depreciation/amortization — relevant for dealer-owned vehicles held as assets
- Allocated overhead — a per-unit share of rent, utilities, and admin
The gap between front-end gross (selling price minus purchase price) and true net profit is where most independent dealers lose visibility. A $3,500 front-end gross can become a $900 net profit once recon, floorplan, and advertising are properly attached.
Pro Tip: Not every overhead item belongs on a per-car basis. Allocate costs that vary with volume (advertising, lot insurance, commissions) per unit. Keep fixed costs like your lease payment in pooled operating expenses and subtract them at the store level, not the vehicle level. This keeps your per-car numbers clean and comparable.
How do you calculate per-car profit?
Start with two formulas, then build from there.
Front-end gross:
Selling Price − Total Acquisition Cost (purchase + auction fees + transport)
True net profit per vehicle:
Selling Price − (Acquisition Cost + Recon + Advertising + Floorplan Interest + Commission + Warranty Reserve + Allocated Overhead)
For a financed or wholesale deal, adjust for any pack, dealer reserve, or F&I income that flows back to the vehicle record.
Step-by-step calculation:
- Record the acquisition cost: purchase price + auction fees + transport to lot.
- Sum all recon: parts, labor, sublet, detail, and inspection invoices tagged to that VIN.
- Add floorplan interest: (daily rate × days held × floored amount). If you held a $12,000 unit for 45 days at a 7.5% annual rate, that’s roughly $111 in interest.
- Allocate advertising: divide your monthly digital ad spend by units sold that month and assign the per-unit average to each vehicle.
- Add commission and any warranty reserve or F&I chargeback allocated to the deal.
- Subtract the total from the selling price to get net profit. Divide net profit by total cost basis to get ROI. Divide total cost basis by net daily profit to get break-even days.
Worked example:
| Line item | Amount |
|---|---|
| Selling price | $18,500 |
| Purchase price | $13,200 |
| Auction fees | $325 |
| Transport | $275 |
| Recon (parts + labor) | $640 |
| Floorplan interest (45 days) | $111 |
| Advertising allocation | $180 |
| Sales commission | $300 |
| Warranty reserve | $150 |
| Total cost basis | $15,164 |
| Net profit | $3,336 |
| ROI | 22% |
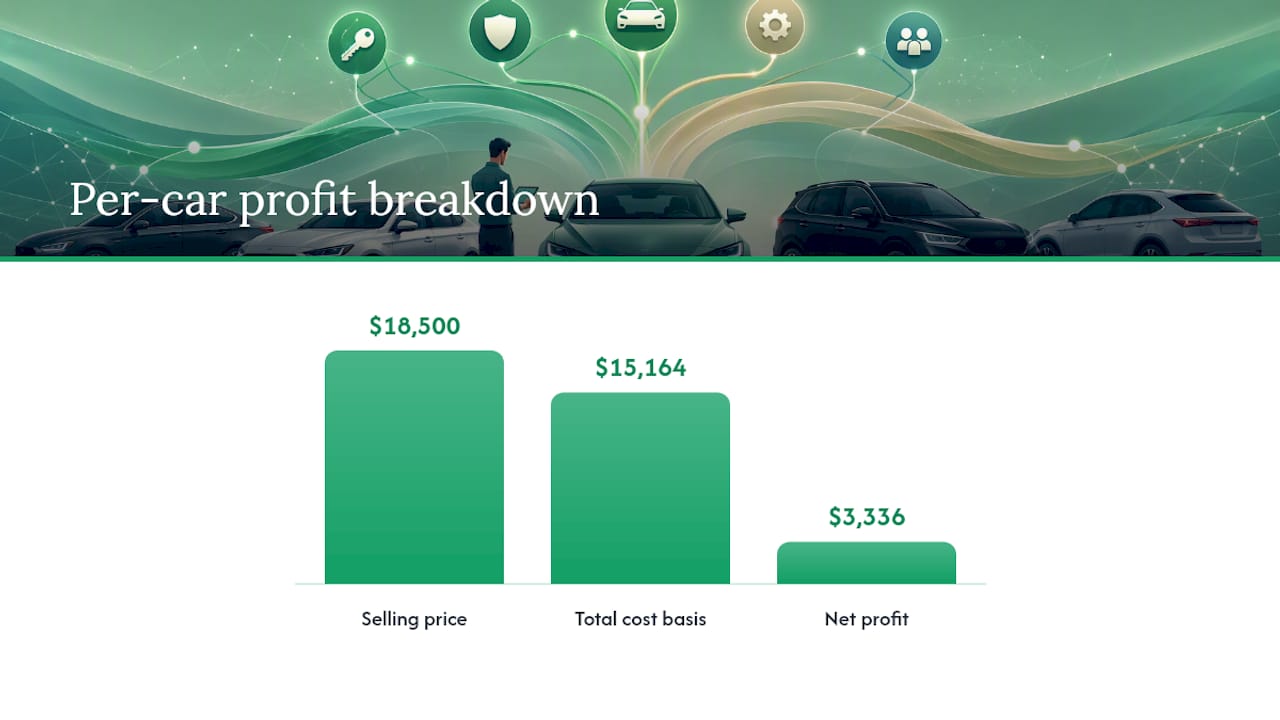
That $3,336 net is what you actually made. The front-end gross on the same deal was $4,700. The $1,364 difference is real money that recon, floorplan, and advertising consumed. For a deeper look at the per-car costing formula, Loturn’s academy walks through additional scenarios including wholesale and trade-in adjustments.
Where do the numbers come from?
Accurate per-vehicle profitability tracking depends on pulling from the right sources and matching every dollar to a VIN before it gets lost in a pooled account.
Primary data sources:
- DMS inventory records — your starting point for acquisition cost and vehicle details
- General ledger (GL) — catches costs that bypass the DMS (credit card charges, ACH payments)
- Recon invoices — shop tickets and sublet receipts; must be tagged to a VIN, not just a date
- Transport and auction receipts — paper or emailed receipts from transport companies and auction houses
- Bank feeds — real-time transaction data that catches charges your team forgot to log
- Credit card statements — a common source of untagged recon and advertising spend
- Floorplan statements — per-unit daily interest from your floor plan lender
Reconciliation workflow: Each week, match every invoice received to a VIN and a purchase record. Any charge sitting in a pooled account without a VIN gets flagged for assignment. Run a short audit: pull all transactions over $50 from the prior week and confirm each one is tagged. Set a sign-off cadence where the owner or office manager reviews untagged items every Friday before the weekly P&L is finalized.
Pro Tip: *The two fastest places to find reconciliation gaps are your credit card statement and your shop’s labor summary. Credit card charges for parts or transport often land in a generic expense account. Shop labor posted as a batch (not per RO) hides recon cost across multiple vehicles.
When should you run per-car profit reports?
Different cadences answer different questions. Running only a month-end report is like checking your rearview mirror after you’ve already missed the turn.
- Daily — confirms new sales activity, flags listing updates, and catches same-day recon charges before they go untagged
- Weekly — the core operational cadence; surfaces negative-net units, recon overruns, and slow-turning inventory before the problem compounds
- Month-end — accounting close, tax-ready figures, and the reconciled P&L your accountant needs
The weekly snapshot is where most independent dealers get the most leverage. A unit sitting at 45 days with a negative net-on-lot (floorplan interest eating into margin) needs a pricing decision now, not at month-end.
| Cadence | Purpose | Owner | Trusted when |
|---|---|---|---|
| Daily | Sales activity, listing sync | Sales manager | All new deals entered same day |
| Weekly | Inventory decisions, recon review | Owner / office manager | All invoices tagged, bank feed current |
| Month-end | Accounting close, tax reporting | Accountant / owner | GL reconciled, all chargebacks posted |
Common mistakes that hide or distort per-car profit
These errors show up in nearly every independent dealership that hasn’t formalized its tracking process.
- Ignoring floorplan interest. A unit held 60 days at 7.5% annual interest on a $15,000 floor costs roughly $185 in interest alone. Dealers who skip this routinely overstate net profit by hundreds per car.
- Failing to tag recon to VINs. When shop labor posts as a weekly batch rather than per repair order, the cost disappears into overhead. The fix: require a VIN on every repair order before the tech clocks out.
- Counting list price as revenue before the sale closes. Pending deals should never appear in your realized profit report. Only posted, funded deals belong in the P&L.
- Misallocating advertising. Assigning your full monthly ad spend to a single unit (or to no unit at all) distorts every vehicle’s margin. Use a per-unit average based on units sold that month.
- Missing auction fees and chargebacks. Gate fees, arbitration charges, and warranty chargebacks often arrive weeks after the sale. Reserve a line for these and reconcile them when the invoice arrives.
- Not carrying warranty reserves. If you sell a dealer warranty and a claim comes back 90 days later, that cost belongs on the original deal’s record, not the month it posts.
To prevent recurrence: create a VIN-tagging policy for every cost category, run monthly spot checks on your GL for untagged charges over $100, and assign one person (owner or office manager) as the reconciliation owner. Governance doesn’t need to be complex. A one-page SOP and a weekly 20-minute audit covers most of it.
What does “good” look like for independent used-car dealers?
Benchmarks give you a target. Without them, you’re setting thresholds in the dark.
Haig Partners reports that used-vehicle front-end gross per unit averaged around $1,500 in late 2024 for public dealerships, reflecting a return to pre-pandemic levels. The Q2 2026 Presidio-NCM benchmark puts gross profit per used vehicle retailed at $1,409, with F&I per vehicle at $1,769 and fixed operations contributing 52.8% of total gross profit.
$1,409 — average gross profit per used vehicle retailed, Q2 2026 (Presidio-NCM benchmark)
Independent dealers typically run leaner than public groups on F&I and fixed ops, so front-end gross carries more weight in the per-unit P&L.
| KPI | Independent dealer target | Notes |
|---|---|---|
| Front-end gross per used unit | $1,200 to $2,000 | Varies by market, price point, and inventory mix |
| Net profit per unit | $800–$1,500 | After recon, floorplan, advertising, and commission |
| Recon cost as % of purchase price | 5–10% | Above 12% signals a buying or recon discipline problem |
| Days-to-turn | 30–45 days | Units past 60 days are actively eroding margin |
| F&I per unit | $500 to $1,200 | Depends on finance penetration and product mix |
Cox Automotive identifies wholesale profit/loss per vehicle and days-to-turn as two of the most critical KPIs dealers should monitor weekly. Use these benchmarks as purchase thresholds: if a unit’s projected net (after estimated recon and 45 days of floorplan) falls below your minimum margin rule, that’s a pass at auction, not a buy.
Spreadsheets vs. dealer platforms: which fits your lot?
The honest answer depends on your volume and how much manual work you’re willing to absorb.
Spreadsheets work at low volume (under 20 units/month) when one person owns the data entry. The problems start fast: no automatic VIN tagging, no bank feed matching, no floorplan interest amortization, and no audit trail. A formula error in one cell corrupts every downstream calculation silently.
Entry-level field apps (mobile-first trackers) handle basic per-car expense attachment and profit calculation. Caryoyo, for example, documents CSV import, per-car expense tagging, depreciation, and ROI and break-even calculations as core features. These tools work for small fleets but often lack GL integration and double-entry accounting.
Dealer-specific platforms handle VIN-level cost tagging, floorplan interest amortization, recon invoice assignment, bank and card feed matching, per-vehicle dashboards, and weekly report automation in one place. The tradeoff is setup time and subscription cost, both of which shrink as volume grows.
Feature checklist for any tool you evaluate:
- VIN-level cost tagging for every expense category
- Floorplan interest amortization (per-unit, per-day)
- Recon invoice attachment or OCR assignment
- Bank and credit card feed matching
- Per-vehicle profit dashboard with net profit and ROI
- Weekly report automation or scheduled export
Loturn’s per-car profit feature covers every item on that checklist. It assigns costs at the VIN level, tracks floorplan interest, integrates with dealer accounting (including a native automotive chart of accounts), and imports existing inventory data to shorten setup. Bank-level encryption protects the financial data. For dealers currently running a spreadsheet plus a generic accounting tool, Loturn typically cuts reconciliation time significantly because the cost tagging and GL entries happen in the same system. The dealer accounting integration means your per-car P&L and your month-end close pull from the same source of truth.
For dealers evaluating whether a dedicated platform makes sense over their current DMS setup, the used car dealer software buyer’s guide covers the evaluation criteria in detail.
How to set up per-car profit tracking in 30/60/90 days
This is a roll-out plan, not a wish list. Each phase has a clear owner and a time budget.
Days 1–30: Setup
- Import your current inventory into your tracking system (DMS export or manual entry); assign purchase price and acquisition date to every unit.
- Map purchase records: attach auction receipts, transport invoices, and buy sheets to each VIN.
- Reconcile the last 30 days of recon invoices: match every shop ticket to a VIN and flag any untagged labor batches.
- Enable bank and credit card feeds; categorize the last 30 days of transactions.
- Assign roles: one person owns weekly data entry, one person owns Friday reconciliation sign-off.
Days 31–60: Stabilization
- Automate or schedule the weekly per-car P&L report (every Friday morning).
- Train your sales and recon teams on the VIN-tagging policy: every repair order and every invoice needs a VIN before it’s posted.
- Set purchase thresholds based on your benchmark targets: define the minimum projected net profit required to buy a unit at auction.
- Start weekly 30-minute review meetings: owner + office manager, reviewing the prior week’s P&L and flagging any unit with negative net or recon overrun.
Days 61–90: Optimization
- Tune overhead allocation: review whether your per-unit advertising average and lot insurance allocation still reflect actual costs.
- Build alert rules: flag any unit where net profit goes negative (floorplan interest has consumed the margin) or recon exceeds 10% of purchase price.
- Integrate per-car data into your accounting close: your month-end GL reconciliation should pull directly from the same VIN-level records.
- Use per-car data in buying decisions: before every auction run, pull the prior 90 days of net profit by vehicle segment to identify which price bands and vehicle types are actually delivering margin.
Why real-time per-car P&L matters more than dealers expect
The conventional wisdom in independent used-car retail is that you know your margin because you know what you paid and what you sold for. That gap is comfortable and familiar. The problem is it’s wrong about half the time.
Recon creep is real. A $400 recon estimate that becomes a $900 invoice, combined with 50 days of floorplan interest on a $14,000 unit, can turn a deal that looked like a $2,500 gross into a $900 net. That’s not a bad month. That’s a bad buying decision that a weekly per-car P&L would have surfaced at day 30, when you still had time to reprice or wholesale the unit.
The dealers I’ve seen get this right share one habit: they treat the weekly per-car report like a buying tool, not just an accounting exercise. When the data shows that a specific price band or vehicle segment consistently underperforms on net profit, they stop buying in that band. That’s the real payoff of per-vehicle profitability tracking. It’s not the report itself. It’s the faster, better-informed buying decisions it enables.
Loturn gives you accurate per-car profit without the spreadsheet chaos
Most independent dealers running spreadsheets spend more time maintaining the spreadsheet than reading the numbers. Loturn is built specifically for used-vehicle dealers who need per-car profit visibility without hiring a bookkeeper to chase invoices every week.
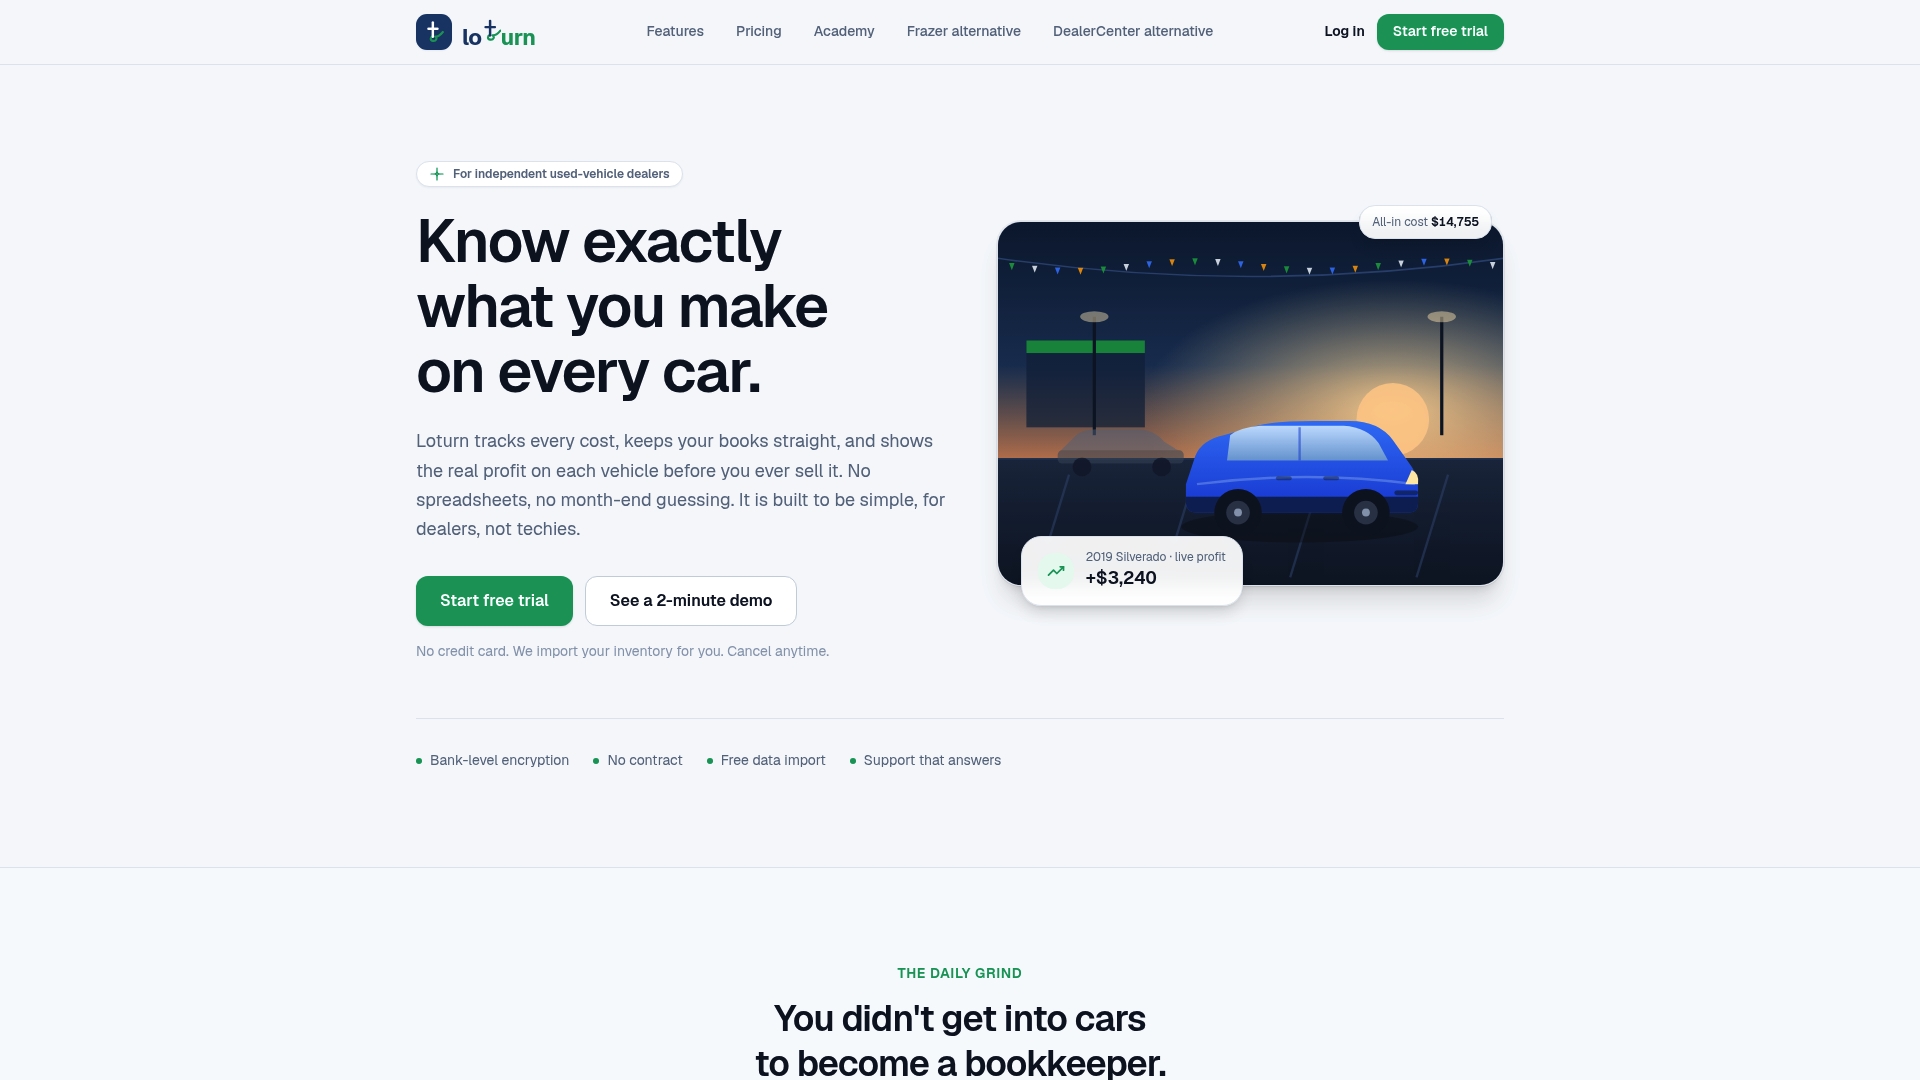
Every cost attaches at the VIN level: purchase price, recon, transport, floorplan interest, advertising allocation, and commission. The per-vehicle dashboard shows your true net profit and ROI in real time, before the sale and after. The native dealer accounting integration means your per-car P&L and your month-end GL close pull from the same data, so there’s no reconciliation gap between what the vehicle record says and what the books say. Setup includes free data import assistance, and bank-level encryption protects every financial record.
Start a free trial at Loturn or explore the dealer accounting features to see how the GL integration works before you commit.
Sources
- Car Dealership Profit Margins 2026: What Dealers Net | VantaInsights
- Used vehicle gross profits slide to pre-pandemic levels: Insights from Haig Partners
- 12 metrics every dealer needs to track | Cox Automotive
- Caryoyo - Turo Fleet Management & Profit Tracking | Caryoyo
FAQ
What is the average profit per car sold?
Presidio-NCM benchmarking puts gross profit per used vehicle retailed at $1,409 in Q2 2026; Haig Partners reported $1,513 in Q4 2024. Net profit after recon, floorplan, and overhead is typically lower, often in the $800–$1,500 range for independent dealers.
What is the $3,000 rule for cars?
The rule is an informal dealer guideline suggesting that a used vehicle should generate a front-end gross sufficient to cover recon, floorplan, and overhead and still leave a meaningful net profit. This is a rough threshold that varies significantly by market and vehicle price point.
How much does a car salesperson make on a $10,000 car?
How do you track car usage and costs for a business?
Attach every expense (recon, transport, insurance, advertising) to the vehicle’s VIN at the time the cost is incurred. Cox Automotive recommends tracking days-to-turn and wholesale profit/loss per vehicle as core weekly KPIs. A dealer platform like Loturn automates this tagging and generates per-vehicle reports without manual spreadsheet entry.
What is profit per vehicle retailed (PVR)?
PVR, or profit per vehicle retailed, is the industry term for the gross profit generated per unit sold, typically measured as front-end gross plus F&I income. It’s the standard benchmark figure reported by Haig Partners, Presidio-NCM, and Cox Automotive, and it’s the starting point for setting per-unit margin targets on your lot.