
The highest-performing used car pricing strategy combines a live wholesale baseline, matched local comps, and a three-price cadence (target, floor, rescue) that you commit to before the car hits the lot. That’s the verdict. Everything else in this guide is the operational detail that makes it repeatable.
Here’s the short version: pull a live Black Book wholesale baseline at intake, match it against at least three live local comps, then set your target price, floor price, and rescue price before you list. Schedule repricing on a calendar, not a gut feeling. That system, backed by Cox Automotive and Manheim index data, is what separates dealers who protect gross from dealers who chase it.
Three steps you can run this afternoon:
- Pull a live Black Book or vAuto wholesale value on your next intake unit.
- Find three live local comps on CarGurus or a similar portal, filtered by trim, mileage, and condition.
- Set your target, floor, and rescue prices in writing before the car goes live, and schedule your first reprice for Day 14.
Cox Automotive’s 2026 used-vehicle sales forecast projects roughly 20.3 million retail used-vehicle sales, down about 0.7% from 2025, with days’ supply around 49. Constrained supply and heightened buyer price sensitivity mean margin is earned at intake and protected through disciplined repricing, not recovered at the desk.
Key Takeaways
A data-driven used car pricing strategy, built on a live wholesale baseline, matched local comps, and a committed three-price cadence, is the most reliable way to protect gross and reduce days-to-turn across your inventory.
| Point | Details |
|---|---|
| Start with a live baseline | Pull a live Black Book or vAuto wholesale value at intake, not a stale PDF, to anchor your floor math. |
| Use the three-price cadence | Set target, floor, and rescue prices before listing; commit to a repricing schedule tied to days-on-market thresholds. |
| Fix what pays, disclose the rest | Repairs that remove more buyer discount than they cost (detailing, CEL clears, tires) are worth doing; structural repairs often are not. |
| Track GPU and days-to-turn | Gross per unit and days-to-turn by segment tell you whether pricing is working; traffic and leads do not. |
| Loturn tracks true cost per unit | Loturn assigns every cost to each vehicle automatically, so your floor price reflects real economics before the deal closes. |
Table of Contents
- What pricing models should dealers actually use?
- How to price a used car from intake to live listing
- Which repairs actually pay for themselves?
- Which market-data tools give you the most reliable pricing signals?
- When should you reprice, and by how much?
- How to protect gross at the negotiation desk
- What KPIs tell you if your pricing is actually working?
- Per-car costing: how to know your true profit before you sell
- The discipline gap no one talks about
- Loturn gives you the per-car profit visibility your pricing needs
- Sources
- FAQ
What pricing models should dealers actually use?
Most dealers default to one model for everything. That’s the mistake. A commodity sedan and a low-mileage certified truck don’t belong in the same pricing framework, and treating them identically costs you gross on one and days-on-market on the other.
Competitive (comps-led) pricing is the baseline for most inventory. You pull live local listings for the same trim, mileage band, and condition tier, then position your ask relative to the market. It works well for high-volume economy units where buyers comparison-shop aggressively. The risk: if your comps are stale or pulled from the wrong geography, you’re pricing against a ghost market.
Value-based pricing applies when the car carries a premium the comps don’t fully reflect: a certified pre-owned (CPO) designation, a fresh service record, new tires, or a bundled warranty. Here, you’re pricing the story, not just the steel. This model fits trucks, low-mileage SUVs, and any unit where reconditioning created a genuine condition advantage.
Dynamic pricing adjusts the ask based on demand signals: days-on-market, search views, save rates, and seasonal shifts. It’s most useful for high-turn segments where a week of data tells you whether the price is right. The pitfall is over-reacting to a slow weekend and cutting too early.
Tiered pricing by segment means you predefine price bands for economy, mid-range, trucks, and luxury, then price every unit within its band. This keeps your floor math consistent and prevents a salesperson from accidentally listing a $28,000 truck at $24,500 because they eyeballed a comp from a different trim.
Psychological pricing works at the margin, literally. Charm pricing ($18,995 instead of $19,000) is standard practice because it works: the left-digit effect is real and well-documented in consumer research. Price anchoring, where you show a higher “market value” alongside your ask, can shorten negotiation time when the anchor is credible (KBB Fair Market Range is a defensible anchor; an inflated MSRP on a used car is not).
The practical recommendation: use comps-led pricing as your default, layer value-based premiums on certified or reconditioned units, and apply psychological pricing at the list stage. Reserve dynamic adjustments for your aging units on a scheduled cadence.
Pro Tip: Add a “Why This Price?” bullet to every listing: one sentence citing the condition tier, one citing the market position (“priced below 7 of 9 local comparables”). vAuto’s research shows that buyers who can validate price fairness on their own terms move faster, which means your transparency is a closing tool, not a concession.
How to price a used car from intake to live listing
This workflow applies to a single unit. Run it every time, and pricing becomes a process instead of a judgment call.
Step 1: VIN and trim match
Pull the VIN and confirm the exact trim, packages, and options. A base trim and a fully loaded trim of the same model can differ by $3,000–$5,000 at retail. Mismatching trim in your comp pull is one of the most common pricing errors in independent stores.
Step 2: Live wholesale baseline
Pull a live Black Book or vAuto wholesale value, not a PDF from last month. Wholesale markets move weekly. The baseline tells you what the car is worth to another dealer today, which sets your absolute floor before recon.
Step 3: Condition assessment and tier assignment
Assign a condition tier (Rough, Average, Clean, Extra Clean) honestly. Overgrading is tempting but it inflates your baseline and leads to a list price the market won’t support. If the car has a check-engine light, a cracked windshield, or worn tires, those are Average or Rough tier items, and the baseline drops accordingly.
Step 4: Recon estimate and fix-vs-disclose decision
Get a recon estimate before you set the price. The decision to fix or disclose changes your cost basis and your list price. More on the ROI math in the next section.

Step 5: Matched live comps
Pull at least three live local comps: same trim, within 25 miles, within 10,000 miles of your unit’s odometer. Local comps and sold-price signals are necessary to set a realistic retail ask.
Step 6: Per-car cost and floor calculation
Add up every dollar tied to this unit:
Your floor is the number below which you’re selling at a loss. Every pricing decision below that line needs a conscious reason (aging unit, wholesale move, bundle offset).
Step 7: Target price and negotiation buffer
That buffer gives the desk room to close without breaching floor.
Step 8: Listing copy and value story
Write three to five value bullets: condition tier, recent service, tire depth, any warranty, and your market position. Buyers research before they call. A listing that answers their questions before they ask shortens the sales cycle.
Pro Tip: Assign step ownership at intake: the appraiser owns Steps 1–3, the recon manager owns Step 4, and the pricing analyst or manager owns Steps 5–8. When one person owns the whole chain, steps get skipped under pressure.
Which repairs actually pay for themselves?
The instinct to fix everything before listing is expensive. The instinct to list everything as-is and “let the market decide” destroys gross. The right answer is in the math.
Buyers price for uncertainty. A car with a check-engine light doesn’t just lose the repair cost from its value; it loses the repair cost plus a risk premium the buyer adds for not knowing what the light means. That gap is where recon ROI lives.
The decision flow is straightforward. Get two shop quotes. Estimate the probable buyer discount the defect creates (use your sales team’s experience and comp data). If it’s close to break-even, fix it and use the repair in your value story. If the cost exceeds the discount, price-to-defect with clear disclosure.
Pro Tip: Disclosure done right actually reduces hostile negotiation. A listing that says “minor paint scuff on rear quarter, priced accordingly” tells the buyer you’ve already accounted for it. They can’t use it as a surprise lever at the desk. Buyers who feel informed close faster and with fewer concessions, per vAuto’s transparency research.
Which market-data tools give you the most reliable pricing signals?
No single tool has the full picture. The dealers who price well use multiple feeds and know what each one is actually measuring.
vAuto is the most widely used pricing intelligence platform in independent and franchise stores. It pulls live market data, shows days-on-market for comparable units, and flags when your price is out of position relative to local supply. Its strength is real-time competitive positioning. Its limit: it’s only as good as the comps it finds, and thin local markets can produce misleading signals.
Kelley Blue Book (KBB) publishes a Fair Market Range updated weekly, factoring transactions, auctions, and listings to produce a local retail guide. KBB is the number buyers trust most, which makes it useful as a listing anchor. Its limit: it’s a retail guideline, not a wholesale baseline. Reconcile it with your Black Book pull before setting your floor.
Black Book provides wholesale baseline values updated weekly from auction data. It’s the right starting point for floor math because it reflects what you’d recover at auction today. Don’t use it as your retail ask; use it as your cost anchor.
Manheim is the largest wholesale auction network in the U.S., and its Manheim Market Report (MMR) is the industry’s primary wholesale volatility signal. When the MMR moves, your floor math moves with it. Checking the MMR weekly is the minimum; in volatile markets, check it more often.
CarGurus shows live retail listings with price history and days-on-market data. It’s the best tool for understanding how long comparable units are sitting and whether the market is absorbing supply at current prices. A unit with 45 days on market at a given price is telling you something the book value isn’t.
Carfax and AutoCheck provide VIN history reports that affect condition tier assignment and pricing. A clean Carfax supports a Clean or Extra Clean tier. An accident or rental history pushes you toward Average and lowers your defensible ask. Use these at intake, not as an afterthought.
A practical reconciliation workflow:
- Pull live Black Book wholesale baseline (floor anchor)
- Check KBB Fair Market Range (retail ceiling reference)
- Pull three to five live CarGurus comps (local market position)
- Review Carfax or AutoCheck for condition adjustments
- Check Manheim MMR for wholesale trend direction
- Set target, floor, and rescue prices with all signals in view
Matching VIN-level characteristics, auction feeds, and live portal listings in the same workflow produces defensible offer ranges and speeds quoting. The goal is one pricing decision per unit, made with all signals visible, not three separate lookups that never talk to each other.
When should you reprice, and by how much?
Repricing on a schedule beats repricing on a feeling. The math is simple: every day a unit sits, it costs you floorplan interest, lot space, and opportunity cost. A car that should have sold at Day 20 for $18,500 and instead sells at Day 55 for $17,200 didn’t just lose $1,300 in gross; it also burned 35 extra days of carry.
The recommended cadence:
- Days 0–14: Weekly review. Hold your target price unless a comp shift or new supply changes the market position.
- Days 15–30: Twice-weekly review. If days-to-first-offer is zero, the price needs attention. Small cuts (1–2%) keep you visible in search sorts without signaling desperation.
- Day 30+: Daily review. You’re now in rescue-price territory. Evaluate whether to cut to your rescue price, bundle with F&I incentives, or move the unit to wholesale.
The three-price cadence (target, floor, rescue) with precommitted timing rules reduces gut-feel repricing and preserves gross across volatility cycles. Define all three prices at intake, before emotion or pressure enters the decision.
Seasonality matters by segment. Convertibles peak in March through May and again in September. AWD and 4WD units carry premiums in snow-belt markets from October through February. Trucks and work vehicles often spike around tax refund season (February through April). Economy cars tied to tax refunds follow the same seasonal curve. When you’re in a seasonal peak for a segment, hold your target price longer. When you’re heading into a seasonal trough, accelerate your repricing cadence before the market softens.
When a unit hits rescue price and still isn’t moving, the decision is binary: wholesale it or bundle it. A financing incentive (rate buydown, deferred first payment) can close a deal without touching the headline price, which protects your advertised price credibility for future shoppers.
How to protect gross at the negotiation desk
Discounting without a policy is just giving money away. The desk needs rules, not just instincts.
A workable discount policy template:
- Salesperson authority: up to $200 off list price, no manager approval required.
- Sales manager authority: $201–$800 off list, requires logging the reason (comp match, condition disclosure, trade adjustment).
- General manager authority: anything above $800, or any deal that breaches the floor price.
- Finance lever first: before cutting headline price, offer a rate buydown, extended warranty, or service credit. These preserve the sticker and often cost less than a straight price cut.
- No floor breaches without a wholesale comparison: if a deal requires going below floor, run the wholesale number first. Sometimes the right answer is “we’ll take it to auction” rather than retailing at a loss.
When a buyer pushes back on a disclosed defect, the correct response is not a price cut. It’s a reminder that the defect is already priced in. “We’ve accounted for the paint scuff in our ask, which is why we’re $1,200 below the comparable clean unit on CarGurus” is a complete answer. Cutting further rewards the push, not the logic.
Value bundles work when the buyer wants to feel like they won something. A $500 service credit costs you less than a $500 price cut (because the service credit is delivered at cost), and it gives the buyer a tangible win to walk away with.
Pro Tip: Track every concession by unit, salesperson, and reason code. After 60 days, you’ll see patterns: which units generate the most desk pressure, which salespeople give away the most, and whether your list prices are consistently too high for certain segments. That data is your next pricing calibration.
What KPIs tell you if your pricing is actually working?
Traffic is not a pricing KPI. Leads are not a pricing KPI. The metrics that tell you whether your used car pricing strategy is protecting margin are:
- Gross per unit (GPU): front-end gross divided by units sold. Track it by segment, not just in aggregate.
- Gross margin %: GPU as a percentage of the sale price. Useful for comparing across price segments.
- Days-to-turn: average days from intake to sale. Segment this by vehicle type and price band.
- Days-to-first-offer: how many days before the first serious offer arrives. A unit with zero offers at Day 14 has a price problem, not a traffic problem.
- Price-decline history: how many times was the price cut, and by how much total, before the unit sold? A unit that sold after three cuts and a 12% reduction was mispriced at intake.
- Reconditioning ROI per unit: recon spend versus the gross uplift it produced. Track this by repair type over time to calibrate your fix-vs-disclose decisions.
- Finance attach rate: the percentage of deals where F&I products were added. A high attach rate means the desk is using finance levers effectively; a low rate means price cuts are doing the work that F&I should be doing.
For a simple A/B pricing test: take two matched segments (same model, similar mileage, similar condition), apply different repricing cadences (weekly vs. twice-weekly after Day 14), and measure GPU and days-to-turn over a 30–45 day window. The segment with better GPU and faster turn tells you which cadence fits that vehicle type.
Your morning operations report should surface: units hitting rescue price today, units over 30 days without an offer, any floor breach from the prior day’s deals, and the current average days-to-turn by segment. Those four items take five minutes to review and prevent the decisions that cost you gross.
Per-car costing: how to know your true profit before you sell
Most dealers know their total monthly gross. Fewer know their gross on the specific unit they’re about to discount. That gap is where margin disappears.
True profit per vehicle requires accounting for every cost tied to that unit before the sale closes. Here’s the full line-item structure:
The floorplan interest line is the one most dealers undercount. For a deeper look at how floorplan carry compounds across aging units, the math gets uncomfortable fast on slow-turning inventory.
Per-car costing changes pricing decisions in a specific way: when you can see that a $600 recon spend on brakes and tires moves the unit from Average to Clean tier and supports a $1,400 higher ask, the math justifies the spend. Without that visibility, recon feels like a cost. With it, it’s an investment with a calculable return.

Pro Tip: Start per-car costing on your 10 highest-cost units this week. You don’t need to overhaul your whole system on Day 1. Pick the units where the stakes are highest, run the full cost formula, and compare the result to your current list price. The gap between what you thought you’d make and what you’ll actually make is the most convincing argument for doing this on every unit.
Software that automates live book pulls, assigns recon costs to individual vehicles, and calculates floorplan carry by day removes the manual error that makes per-car costing feel burdensome. When the cost basis updates automatically as days accumulate, pricing decisions stay current without a daily spreadsheet audit.
A store that adopted per-car costing across its full inventory typically sees two changes within 60–90 days: average days-to-turn drops because pricing is set correctly at intake rather than corrected after aging, and GPU improves because floor breaches become visible before the deal closes rather than after.
The discipline gap no one talks about
Most dealers who struggle with pricing don’t have a data problem. They have a discipline problem.
The tools exist. Black Book, vAuto, KBB, Manheim, CarGurus — every signal you need is available, often in real time. What’s harder is building the organizational habit of using them consistently, at intake, on every unit, before the pressure of a slow week or a pushy buyer changes the calculus.
The most common failure mode I’ve seen is the “stale book pull.” A manager pulls a value at auction, writes it on a sheet, and that number becomes the pricing anchor for the next three weeks while the wholesale market moves underneath it. By the time the unit is listed, the baseline is wrong, the comps have shifted, and the list price is either too high to attract offers or too low to protect gross.
The second failure mode is organizational: pricing decisions made by whoever is available rather than whoever owns the process. When the salesperson, the manager, and the owner all have different ideas about what a unit should sell for, the number that wins is usually the one that closes the deal fastest, not the one that protects the margin.
The dealers who get this right treat pricing like a manufacturing process. Inputs go in (live book, comps, condition, recon), outputs come out (target, floor, rescue), and the process runs the same way every time. That consistency is what makes the KPIs meaningful, because you’re measuring the same process, not a different judgment call each week.
Loturn gives you the per-car profit visibility your pricing needs
Knowing your true cost basis on every unit is the foundation of every pricing decision in this playbook. Loturn is built specifically for independent used-vehicle dealers who need that visibility without the complexity of generic accounting software.
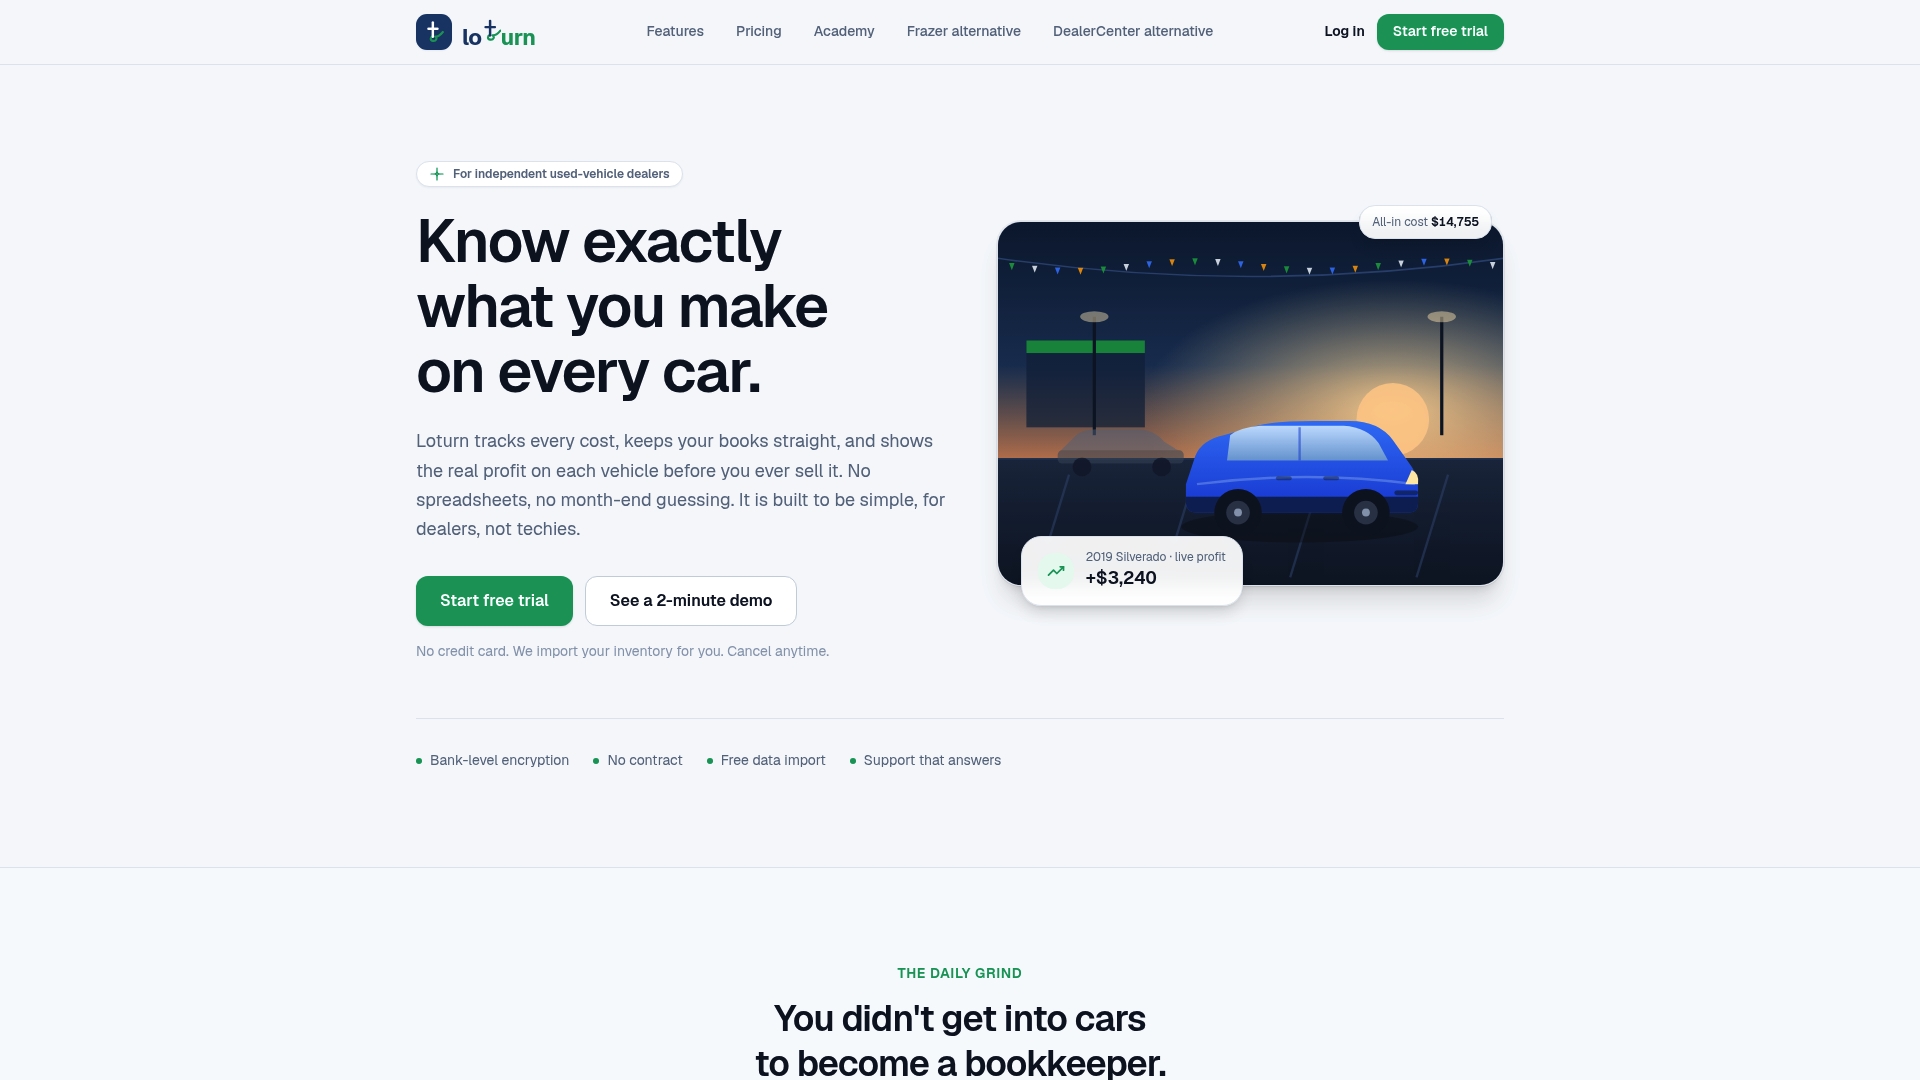
Loturn tracks every cost tied to each vehicle from the moment it enters your inventory: acquisition price, transport, recon parts and labor, floorplan interest by day, and advertising fees. The result is a live per-car profit number that updates as costs accumulate, so your pricing decisions are always based on current economics, not last week’s estimate.
Key features that plug directly into this pricing workflow:
- Per-car profit dashboard: see true front-end gross on every unit before you negotiate
- Recon cost assignment: attach every parts and labor invoice to the specific vehicle
- Floorplan carry calculator: daily interest accumulates automatically so aging costs are always visible
- Native double-entry accounting: automotive chart of accounts built in, no QuickBooks workaround needed
- Listing syndication: push your priced inventory to web platforms directly from the platform
Setup takes days, not months, and Loturn’s team handles free data migration so you’re not starting from scratch. See how per-car profit tracking works, or visit Loturn to start a free trial.
Sources
These are the core data feeds worth integrating into a daily pricing workflow:
- Used Car Pricing Strategy to Protect Dealer Margin | vAuto
- Used retail vehicle sales—December 2025 | Cox Automotive
- Pricing your car — Dr. Vin
- Autocorp
- Used-Car Pricing Playbook for Wholesale Volatility | Showroom Solutions
- Used Cars & Used Car Prices | Kelley Blue Book
FAQ
What is the $3,000 rule for used cars?
The $3,000 rule is an informal dealer guideline suggesting that the minimum front-end gross target per used unit should be around $3,000 to cover overhead, recon, and floorplan costs while leaving a meaningful margin. It’s a rough benchmark, not a formula; your actual floor depends on your per-car cost basis, which varies by unit.
How much can you negotiate off a used car’s asking price?
What should you never tell a car salesperson during negotiation?
Don’t reveal your maximum budget, your monthly payment target, or that you’re in a hurry to buy. Each of those signals shifts leverage to the desk. Focus the conversation on the out-the-door price of the specific vehicle, not on monthly payment math, which can obscure the true cost of the deal.
How do dealers use KBB versus Black Book for pricing?
KBB’s Fair Market Range is a retail guideline updated weekly, useful as a buyer-facing anchor and listing reference. Black Book provides wholesale baseline values that reflect what the car would bring at auction today. Dealers use Black Book to set the floor and KBB to frame the retail ask, reconciling both against live local comps before finalizing the list price.
How often should a dealer reprice a used car?
The recommended cadence is weekly for Days 0–14, twice-weekly for Days 15–30, and daily from Day 30 onward. Precommitted timing rules tied to days-on-market thresholds prevent the late, deep markdowns that erode gross on aging inventory.