
A dealership profitability dashboard is one screen that shows where your money is made and lost: gross profit per unit, net margin, inventory age, floorplan interest and cash. For an independent used-car dealer, the most useful version starts at the vehicle level. It adds the purchase price, transport, recon and fees to each VIN, so you see the real profit on every car before you sell it, not weeks later when the books are closed.
This guide covers what belongs on the dashboard, how each number is calculated, which benchmarks to compare against, and how to keep the data clean enough to trust.
TL;DR
- A profitability dashboard turns your deal, inventory and expense data into a few numbers you can act on weekly: gross per unit, margin, days in inventory, floorplan cost and cash.
- For a used lot, the foundation is true cost per VIN: purchase price plus transport, auction fees, recon, detail and floorplan interest.
- Benchmarks from NADA-linked and CPA sources help, but your own trend line matters more than any industry average.
- A dashboard is only as good as the records behind it. Post every cost to the right vehicle when it happens.
- Loturn tracks every cost per vehicle and shows live profit per car, starting at $99 per month.
Table of Contents
- What a dealership profitability dashboard actually shows
- Start with true profit per vehicle
- The KPIs worth putting on the dashboard
- Benchmarks: use them as a compass, not a grade
- What data should feed the dashboard
- Using the dashboard to make decisions
- Build it in a spreadsheet or use software
- Loturn: live profit per car for independent dealers
- A simple weekly dashboard routine
- FAQ
- Sources
What a dealership profitability dashboard actually shows
A dealership profitability dashboard is a business-intelligence view that turns raw dealer data into profit views by department, model and salesperson. It supports decisions with metrics such as gross profit per unit, finance reserve and cash-flow tracking.
Franchise stores run those views across new cars, used cars, F&I and a service department. An independent lot is simpler and more exposed. You usually have one department that matters, used retail, and a few dozen to a few hundred units on the ground. One bad recon bill or one car that sits for 120 days can erase the margin from several good deals.
So a dashboard for an independent should answer five questions at a glance:
- What did each car really cost me, and what is it on track to make?
- Which cars are aging, and what are they costing me every day?
- Is my gross per unit holding up, or slipping?
- What is the floorplan line costing me?
- Will I have cash to buy next week’s inventory?
Everything else is optional.
Start with true profit per vehicle
Most dealer frustration with profit comes from one habit: counting the sale price minus the purchase price as the gross. The real number includes everything that went into the car.
The per-vehicle formula is:
Vehicle gross = sale price - (purchase price + auction and buyer fees + transport + recon parts and labor + detail + other direct costs + floorplan interest)
Here is an illustrative example with round numbers, not a benchmark:
| Line | Amount |
|---|---|
| Sale price | $18,500 |
| Purchase price | $13,800 |
| Auction and buyer fees | $450 |
| Transport | $300 |
| Recon (parts, labor, tires) | $1,150 |
| Detail and photos | $175 |
| Floorplan interest over 52 days | $210 |
| Total cost in the car | $16,085 |
| True gross | $2,415 |
The quick math (sale minus purchase) says $4,700. The true figure is about half of that. If you price the next similar car off the first number, you will keep buying at prices that look fine and earn very little.
The cost buckets to capture on every unit:
- Acquisition: purchase price, buyer’s fee, title and registration fees paid at purchase.
- Transport: inbound hauling, fuel for driver pickups, transit insurance.
- Recon: mechanical, body, tires, glass, parts, outside vendors and in-house labor.
- Presentation: detail, photos, inspection, safety or emissions tests.
- Carrying cost: floorplan interest and fees, plus any lot-specific costs you allocate.
- Deal-side items: doc fees, add-on products, commissions and spiffs tied to the sale.
Our academy covers the mechanics in detail: the per-VIN unit cost rollup shows how costs stack into one number, and the recon WIP accounting guide explains how to catch recon overruns before the car is finished. If you are on a floorplan, the per-VIN floorplan utilization analysis shows what each day on the line costs.
The KPIs worth putting on the dashboard
Published KPI lists run to dozens of items, many written for franchise stores with service bays and new-car allocations. An independent used-car lot needs a short list. Here is how the common ones are defined, with the sources that define them.
Profit metrics
Gross profit margin is gross profit divided by sales, times 100. Automotive Training Network cites a benchmark of 12-15% for used cars. Net profit margin is net profit divided by sales, times 100, with a benchmark of 2-4% and 6% called excellent.
Average gross profit per unit matters more than volume alone. NHADA’s guidance says to break used-vehicle gross down by source and by age-to-retail, so you can see whether auction buys, trade-ins or street purchases make you more money, and whether fast sellers beat slow ones.
Fixed expense coverage compares total gross profit with total fixed expenses, and NHADA describes it as a proxy for operational breakeven. For a small lot, that is your rent, payroll, insurance, software and utilities against the gross the lot produced this month. It tells you how many cars you must sell just to keep the doors open.
Expense as a percentage of gross profit is operating expenses divided by gross profit, times 100. Automotive Training Network gives 75-80% as a benchmark.
Return metrics
The NADA slide guide defines net profit return on sales as total dealership net profit divided by total dealership sales, with a guide figure of 4.00%. It also gives return on assets (15%-20% guide) and return on equity (25%-30% guide). These are built for full-line dealerships, so treat them as reference points for the shape of the calculation rather than a target your lot must hit.
Inventory and cost metrics
- Days in inventory per unit and by age bucket (0-30, 31-60, 61-90, 90+). It is the earliest warning on a car that is eating margin.
- Recon cost per unit against your own average, so you notice when one vehicle goes far over.
- Floorplan interest expense ratio, which Baldwin CPAs defines as monthly floorplan interest divided by average inventory balance.
- Units sold and average days to sale, so you can see turn alongside gross.
A note on turn: a $3,000 gross on a car that sells in 30 days is a better deal than $4,500 on a car that sits for 90, once you count carrying cost and the cash tied up. Showing gross and days side by side on the same row is one of the most useful things a dashboard can do.
Sales funnel metrics
If you track leads, Baldwin CPAs defines lead-to-sale conversion as units sold divided by qualified leads, times 100. It cites 20-25% for internet leads and 30-35% for walk-ins in mid-sized Kentucky markets, so use those as a local reference, not a national rule.

Benchmarks: use them as a compass, not a grade
Benchmarks from the sources above are written mostly for franchise dealers, and they come from different years. The EisnerAmper dealer KPI guide dates to 2017, and the NADA guide is a 2026 publication. Your own history is the better comparison.
A practical approach for a small lot:
- Pull the last 12 months of sold units and compute your average true gross per unit, average days to sale and average recon per unit.
- Set those as your baseline.
- Compare each month and each quarter against the baseline, not against a national average.
- Use outside benchmarks, such as the 12-15% used gross margin range, to sanity-check whether your pricing and buying are in a reasonable zone.
Segment before you average. A $6,000 car and a $28,000 truck should not share one margin target. Split by price band, by body type, or by source (auction, trade-in, wholesale buy) and the patterns become obvious.
What data should feed the dashboard
A dashboard is a mirror. If receipts are missing, the picture is wrong, and polished charts only make a wrong number look convincing.
NCM Associates notes that dealerships often rely on outdated or incomplete information, and it argues for integrating DMS, CRM and accounting tools to get real-time visibility into inventory levels, sales trends and expense patterns. PAM’s guide recommends standardizing key fields such as VIN and customer ID, with deduplication and validation rules, and assigning someone to own data quality.
For an independent dealer, that translates into a short set of habits:
- One record per VIN. Every cost, from the auction invoice to the last detail bill, attaches to the VIN, not to a general expense bucket.
- Post costs when they happen. A receipt that waits until month end is a receipt that gets lost. Our deal posting checklist lists what to confirm before a deal is considered closed.
- Separate inventory from expense. Recon on a car in stock is part of the car’s cost, not an operating expense. The inventory costing guide walks through per-VIN costing.
- Book floorplan and open-lot inventory correctly. The treatment differs, and so do the numbers on the dashboard. See open lot vs floorplan accounting.
- Reconcile monthly. Match floorplan statements to your VIN list, using a process like the month-end floorplan reconciliation.
- Name an owner. One person, even if it is you, is responsible for making sure every unit has complete costs.
If you are cleaning up messy history, start with the cars currently in stock and the last 90 days of sold units. Older data matters less than getting today’s inventory right.
Using the dashboard to make decisions
The point of the dashboard is to change what you do on Monday morning. Some uses worth building into a weekly routine:
Reprice aging units. Sort by days in inventory and by profit remaining. A car at 75 days with $1,200 of room left is a different call than one at 75 days with $200 left.
Catch recon creep. If you set a recon budget at purchase, compare actual recon to budget while the car is in the shop. The overrun costs the same whether you notice it on day 5 or after the sale.
Learn which buys pay. After a few months, per-VIN data tells you which sources, makes and price bands return the best gross per day on the lot. Buy more of those.
Watch floorplan cost. Floorplan interest accumulates quietly. Our guides on floorplan cash flow and same-day lien payoff cover how dealers keep the line from draining cash.
Forecast with scenarios. NCM Associates recommends scenario-based forecasts (best, worst and expected) reviewed monthly against budget variance, and suggests factoring in seasonal trends, incentives, interest rates and competition. For a used lot, a 13-week cash flow forecast is the practical version of that advice.
Build it in a spreadsheet or use software

You can start with a spreadsheet: one row per VIN, columns for each cost bucket, sale price, days in inventory and a formula for true gross. It works for a handful of cars. It gets fragile past a few dozen units, when receipts arrive from several people, when floorplan interest has to be allocated daily, and when your accountant needs the same numbers in the books.
The common failure is two sets of numbers: a sheet that shows per-car profit and a bookkeeping file that shows monthly totals, which never quite agree. A system where the per-vehicle costs and the accounting are the same data avoids that.
Our perspective
We built Loturn because we kept hearing the same sentence from independent dealers: “I don’t know what I made on that car until my accountant tells me.” Generic bookkeeping tools are built around months and categories. A dealer’s business is built around vehicles.
That is why we put cost tracking at the VIN level and treat the dashboard as an output of the accounting, not a separate report. Purchase price, transport, recon and floorplan interest all sit on the unit, inside a native double-entry ledger with an automotive chart of accounts. Profit per car is not an estimate assembled at month end. It is live, and it is meant to be the number you use before you price, before you buy and before you sell.
We also believe a small lot should not need a stack of add-ons to get there. Inventory, accounting, CRM, deal paperwork and reporting are included in one flat monthly price, and we import your existing data for free so you start with a working picture.
Eric Dosset
Loturn: live profit per car for independent dealers
Loturn is a financial management platform built for independent used-vehicle dealers. It tracks every cost against each vehicle, from purchase price to transport and recon, so you can see true profit before a sale. It also covers inventory for cars, RVs, boats, bikes and trailers, floorplan interest tracking, reporting, an integrated CRM, deal paperwork automation and AI invoice and document management. Data is protected with bank-level encryption, and setup includes free data import.
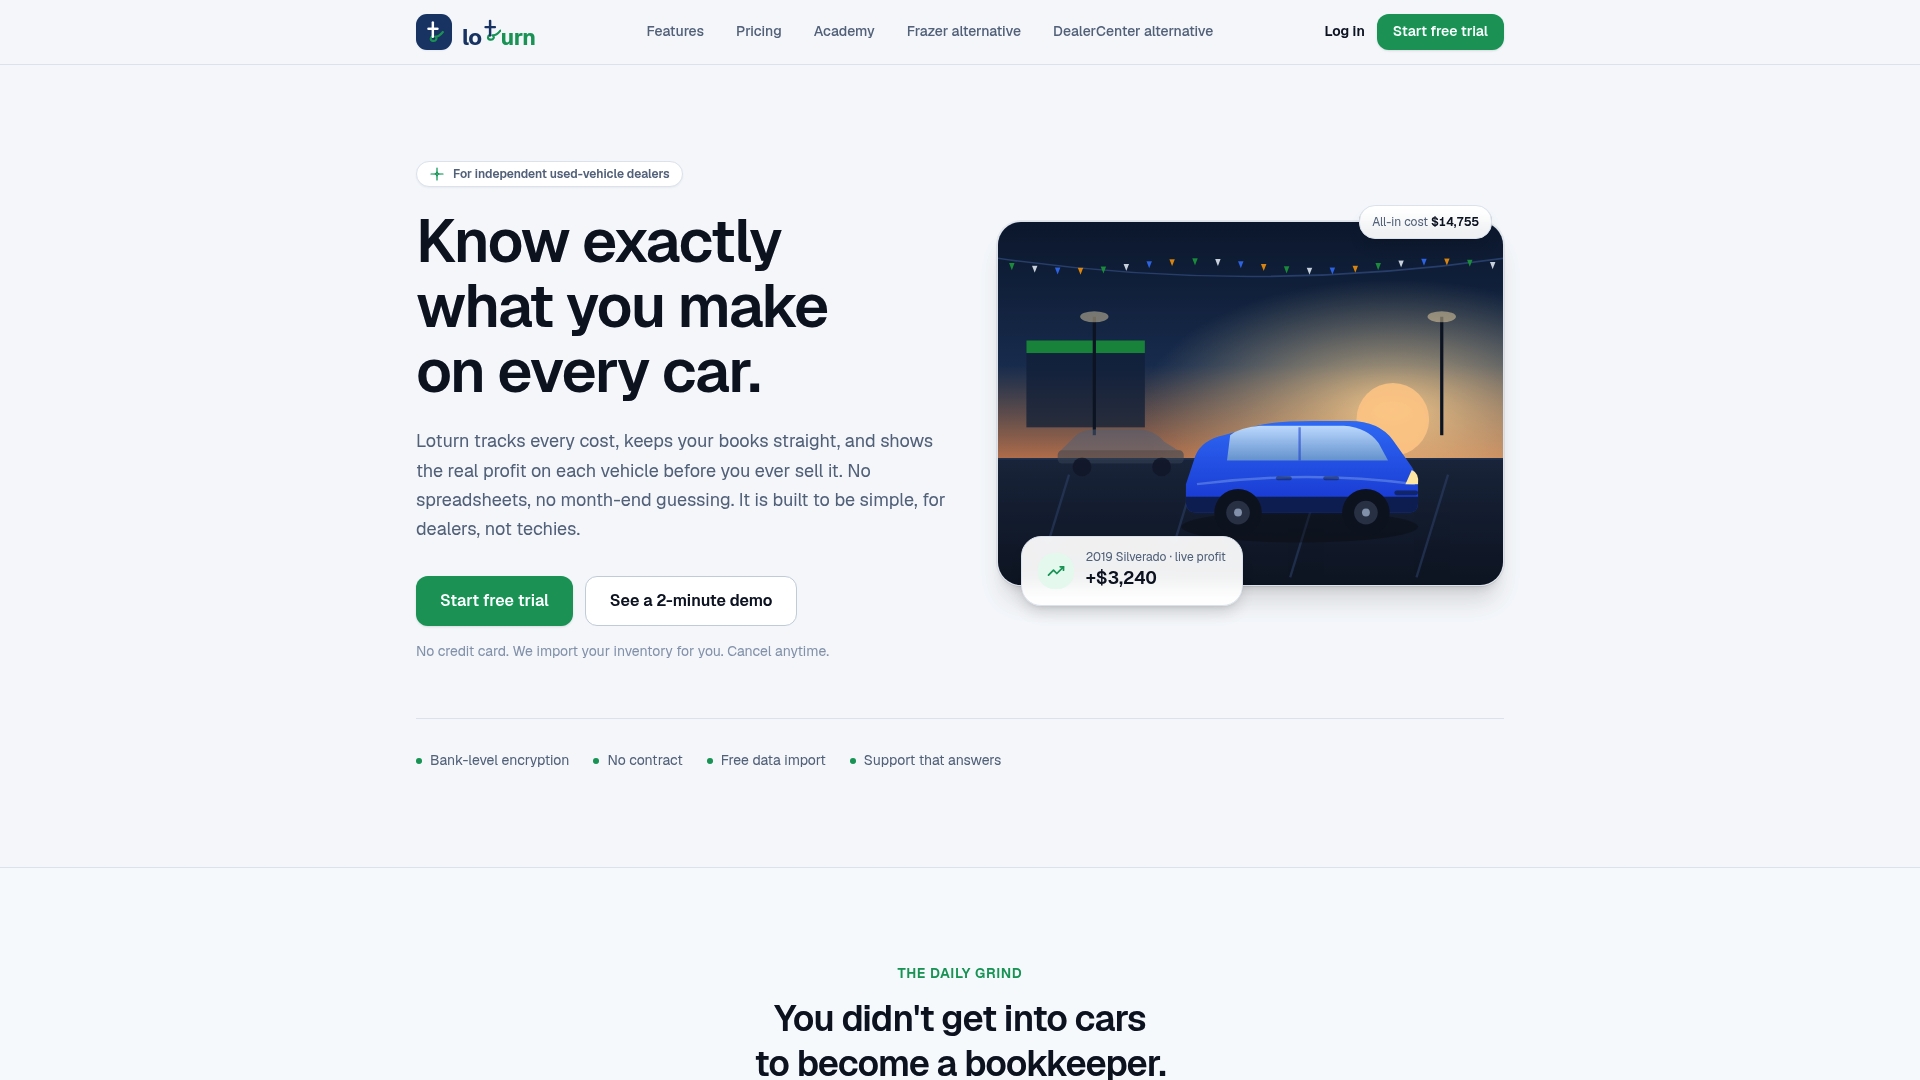
Plans are flat monthly prices based on dealership size and volume: Flipper at $99 per month, Dealer at $349 per month and Multi-Lot at $699 per month. See what fits your lot on the Loturn pricing page, or visit Loturn to learn more.
A simple weekly dashboard routine
Whether you use a spreadsheet or software, a short routine keeps the numbers useful:
- Monday, 15 minutes: review inventory by age. Flag every unit past your target days and decide on a price action.
- Monday, 10 minutes: check any car in recon against its budget.
- Friday, 15 minutes: review deals closed this week, with true gross per unit and any missing costs.
- Monthly: compare gross per unit, days to sale, expense ratio and floorplan interest against your baseline, then reconcile floorplan statements.
- Quarterly: segment by source and price band and adjust your buying.
The discipline matters more than the tool. A dashboard no one opens changes nothing.
FAQ
What should a dealership profitability dashboard include?
Start with true gross per unit, gross margin, days in inventory, recon cost per unit, floorplan interest and expense as a percentage of gross profit. Add fixed expense coverage to see your breakeven and a cash view for the next several weeks. Lead conversion is useful if you track leads.
What is a good gross profit margin for a used car dealer?
One published benchmark puts used-car gross margin at 12-15% of sales. Your number depends on price band, source and how fully you count costs. Measure it the same way every month so the trend means something.
How do I calculate profit on a single vehicle?
Subtract every cost tied to the car from its sale price: purchase price, auction fees, transport, recon, detail and floorplan interest. Add deal-side costs such as commissions where they belong to that sale. The remainder is true gross for that VIN.
How often should I review the dashboard?
Look at inventory age and recon spend weekly, since those move fastest. Review margins, expense ratios and floorplan cost monthly. A quarterly segmentation by source and price band guides your buying.
Can I use a spreadsheet instead of software?
Yes, for a small number of units. It becomes harder to maintain as volume and the number of people posting costs grow. Software that ties per-vehicle costs to the accounting keeps one set of numbers.
Sources
- A Complete Guide On Data Analytics For Car Dealers (PAM)
- Auto Dealership KPIs: Building a Reporting Dashboard (Baldwin CPAs)
- NADA Slide Guide
- 10 Car Dealership KPIs Every Dealer Principal Must Track (Automotive Training Network)
- Using KPIs to Detect Trends and Avoid Costly Errors (NHADA)
- Budgeting and Forecasting in the Auto Industry (NCM Associates)