
The fastest way to reduce aged inventory is to run an inventory aging report, flag at-risk SKUs against sell-through and days-on-hand triggers, then work them down a prioritized clearance ladder starting with the cheapest option (bundling) before moving to markdowns, outlet channels, and liquidation. Done consistently, this frees cash, cuts carrying costs, and lowers the odds you end the year with a painful write-down.
TL;DR:
- Consistently tracking inventory age by category-specific thresholds helps identify SKUs that are at risk of requiring quick clearance actions.
- Building a detailed inventory aging report with key data fields and formulas allows precise calculation of days on hand and dollar at risk for each SKU.
- Implementing a staged clearance ladder, starting with bundling and shallow markdowns before moving to outlets or liquidation, maximizes cash recovery and preserves margins.
- Monitoring signals like rising days on hand, low sell-through, and no-sales intervals offers early warning before aging buckets confirm stock needs clearance.
- Regularly reviewing KPIs and root causes of aged stock ensures purchasing and demand planning adjustments prevent future inventory aging problems.
Table of Contents
- What Is Aged Inventory and Why Does It Hurt Cash Flow?
- How Do You Build an Inventory Aging Report?
- What Signals and Thresholds Should You Flag First?
- The Clearance Ladder: Which Tactic Recovers the Most Cash?
- How Do You Prioritize and Run a 30/90-Day Cleanup Plan?
- Which Report Features Actually Speed This Work Up?
- How Do You Find the Root Cause Behind Aged Inventory?
- How Should Reduction Strategies Connect to Sales Forecasting?
- How Do You Prevent Aged Inventory From Coming Back?
- Why Daily Discipline Beats the Annual Write-Down Ritual
- Run Your Aging Reports Without Rebuilding Spreadsheets Every Week
- Sources
- FAQ
What Is Aged Inventory and Why Does It Hurt Cash Flow?
Aged inventory is stock that has sat past a category’s normal selling window without a sale. It differs from dead stock, which has gone past the point of realistic sale at any reasonable margin and now mainly generates carrying cost with no offsetting revenue. Most operators treat anything sitting more than 90 days as aged and anything past 120 to 180 days, depending on the category, as dead.
The financial drag is bigger than most owners assume. Dead stock typically carries an annual holding cost equal to 20% to 30% of its value once you count storage, insurance, financing interest, obsolescence, and the opportunity cost of cash tied up instead of working. On a $20,000 unit, that is $4,000 to $6,000 a year quietly leaking out, whether or not it ever sells.
Pro Tip: Calculate your own carrying-cost rate once using a tool like the holding cost calculator, then apply that rate to any SKU sitting past 60 days. It turns “it’s just sitting there” into a dollar figure that forces a decision.
Aging buckets vary by category because sell-through speed varies:
- Fast-moving retail or parts: 0 to 30 days is healthy, 31 to 60 is a watch zone, 60+ is aged.
- Used vehicles and big-ticket items: 0 to 30 is fresh, 31 to 60 is normal, 61 to 90 needs a pricing review, and 90+ is a red flag.
- Seasonal goods: age fast right after the season ends, regardless of the calendar-day count.
The bucket boundaries matter less than having any consistent boundary at all. Without one, “aged” becomes a feeling instead of a number, and feelings don’t show up on a balance sheet.
How Do You Build an Inventory Aging Report?
An inventory aging report sorts every SKU by how long it has sat unsold, then groups those SKUs into buckets so you can see where capital is trapped. Building one requires six data fields, four formulas, and about 20 minutes in a spreadsheet if your data is clean.
Required fields for each item:
- SKU or unit identifier (VIN for vehicles)
- Unit cost (landed cost, including freight and prep)
- Receipt date (when it entered inventory)
- Sales history (units sold per period, if applicable to the category)
- Cost of goods sold (COGS) for the period
- Location, if you operate more than one lot or warehouse
The four formulas that make the report useful:
- Average inventory = (Beginning inventory + Ending inventory) ÷ 2
- Inventory turnover ratio = COGS ÷ Average inventory
- Days on hand (average inventory age) = 365 ÷ Inventory turnover ratio
- Individual item age = Today’s date minus receipt date
These calculations, laid out in detail in Novexit’s aged-inventory guide, let you move from “this feels old” to a specific day count you can act on. A turnover ratio of 4 means your average dollar of inventory sits for roughly 91 days before selling. A ratio of 12 means about 30 days. That single number tells you whether your buying pace matches your selling pace.
Spreadsheet walkthrough:
- Export unit-level data (SKU, cost, receipt date) from your inventory or dealer management system.
- Add a column that calculates
TODAY() minus receipt datefor each row. - Create bucket columns (0 to 30, 31 to 60, 61 to 90, 90+) using an
IFformula referencing the age column. - Sum the cost column by bucket to see dollars, not just unit counts, trapped in each range.
- Sort the 90+ bucket by cost descending. That’s your action list, ranked by dollars at risk.
| Bucket | Typical status | Action posture |
|---|---|---|
| 0–30 days | Fresh | Monitor only |
| 31–60 days | Normal aging | Confirm pricing is competitive |
| 61–90 days | At risk | Begin markdown or bundling review |
| 90+ days | Aged/dead | Move to clearance ladder |
The Shopify aging-report framework uses this same bucket structure, and it works whether you’re tracking sneakers or sedans. If you run multiple locations, run the report per location first, then rolled up. A unit that looks fine company-wide can be sitting dead on one lot while another location cannot keep the same SKU in stock.
What Signals and Thresholds Should You Flag First?
Not every aged item deserves the same urgency. Three leading indicators tell you which SKUs to act on before the aging bucket even confirms it:
- Rising days on hand relative to rolling 30-day sales. If an item’s days on hand is climbing while its trailing sales rate is flat or falling, demand has shifted and price has not caught up.
- Low sell-through percentage. Units sold divided by units available, over a fixed period. Anything under 30% to 40% in a 60-day window on non-seasonal goods is a warning sign.
- No-sales interval. How many days since the last unit in that SKU family sold anywhere in your operation, not just this specific location.
Adjust both numbers up for high-margin, slow-turn categories (specialty parts, luxury goods) and down for thin-margin, fast-turn categories, where even a modest slowdown burns cash quickly.
Before you act on any of these signals, reconcile the data. Phantom inventory, units that show as in stock but were sold, returned, or damaged and never updated in the system, will send you chasing problems that don’t exist. A quick physical spot-check on your top 20 flagged SKUs before launching markdowns avoids that waste, and fixing the feed errors that cause it in the first place, covered in Loturn’s guide on stopping phantom sales, pays for itself the first time it prevents a wrong markdown.
Pro Tip: Run the reconciliation check on dollar value, not unit count. Ten phantom units at $50 each barely move your numbers. One phantom unit at $18,000 can completely distort your at-risk list.
The Clearance Ladder: Which Tactic Recovers the Most Cash?
The single biggest margin mistake in clearing aged stock is starting with a deep, sitewide markdown. It moves inventory, but it also trains customers to wait for discounts and leaves money on the table that a staged approach would have captured. The better method is a clearance ladder, working from the highest-recovery tactic down, only escalating when the previous rung fails to move the unit within a set window.
| Ladder rung | Typical recovery | Best used when |
|---|---|---|
| Bundling | 60¢ to 80¢ per dollar of cost | Item is 60 to 90 days old, still desirable paired with something else |
| Shallow markdown (on-site) | 40¢ per dollar of cost | Sell-through is below threshold but demand still exists |
| Outlet or marketplace channel | 30¢ to 60¢ per dollar of cost | Item has stalled locally but sells elsewhere |
| Liquidation broker | 20¢ to 40¢ per dollar of cost | Item is 120+ days old with no local demand signal |
| Donation or write-off | Minimal cash, but stops the carrying-cost bleed | Item has no viable sales path left |
These ranges come from a dead-stock clearance framework built around protecting margin while still forcing cash out of stalled inventory. The logic: every rung down the ladder recovers less, so you only move to the next one when the current tactic has had a fair shot and failed.
Map the ladder to your aging buckets:
- Early stage (31 to 60 days): No discount yet. Refresh the listing, improve photos or description, confirm the price is competitive, and consider a bundle with a complementary item. Refreshing product copy at this stage often restores visibility without touching margin at all.
- Mid stage (61 to 90 days): Apply a shallow, time-boxed markdown, 5% to 10%, tied to a specific sell-through trigger rather than an arbitrary calendar date. Cap the discount and set a hard end date so it doesn’t quietly become the new permanent price.
- Late stage (90+ days): Rechannel to an outlet, marketplace, or wholesale buyer. If that fails within 30 days, escalate to a liquidation broker or bulk sale, accepting a lower per-unit return in exchange for speed.
Pricing cadence matters as much as the discount depth.
The carry-versus-liquidate decision rule is simple math: if this month’s carrying cost on the unit exceeds the gap between its current asking price and its best available liquidation offer, liquidate now. Segmenting inventory into A, B, and C tiers before you touch pricing, an approach detailed by Growth Partner’s clearance research, helps you protect margin on A-tier items while moving C-tier stock fast without agonizing over each one individually.
How Do You Prioritize and Run a 30/90-Day Cleanup Plan?
Combine ABC classification with your aging buckets rather than treating them as separate exercises. A-tier items (your highest-margin, highest-velocity SKUs) rarely need clearance action even when they age slightly, because demand usually catches up. C-tier items that are also aged 90+ days are your top priority regardless of how small the dollar amount looks per unit, because they’re the ones quietly compounding carrying cost with the least chance of recovering it. Reference frameworks from organizations like APQC support this pairing as standard operations practice.
Set explicit triggers so action isn’t a judgment call every time:
- No sales in 45 days on a non-seasonal SKU triggers a listing refresh and price check.
- No sales in 90 days triggers a shallow markdown with a sell-through target.
- Days on hand exceeds 2x the rolling 30-day sales pace triggers escalation to outlet or marketplace channels.
- Days on hand exceeds 3x that pace with no bites in 30 days triggers liquidation or write-off review.
30-day checklist:
- Run the full aging report and reconcile against physical counts.
- Tag every SKU with its ABC tier and age bucket.
- Launch listing refreshes and bundling on early-stage aged items.
- Set sell-through triggers and markdown caps for mid-stage items.
- Route any 90+ day, C-tier item to outlet or liquidation review.
90-day cadence:
- Rerun the aging report every 30 days, tracking whether the 90+ bucket’s total dollar value is shrinking.
- Track three KPIs monthly: average days on hand, sell-through percentage, and cash recovered from clearance activity.
- Review which category or supplier keeps generating aged stock, since the same problem area often shows up quarter after quarter.
A holding-cost estimate of 20% to 30% annually on stalled value gives you a rough target: if your 90+ day bucket holds $150,000 in cost, you’re bleeding $30,000 to $45,000 a year just carrying it. That number, tracked monthly, tends to get cleanup plans funded a lot faster than a vague warning about “old stock.”
Which Report Features Actually Speed This Work Up?
Running this playbook by hand in a spreadsheet works, but it eats hours every week. The features that cut that time down share a common thread: they attach real numbers to individual units instead of category averages.
- Per-item days-on-hand tracking that updates automatically instead of requiring a manual date calculation on every row.
- Rolling 30-day sales averages built into the report, not calculated separately in a side spreadsheet.
- Per-unit cost assignment that includes acquisition, transport, and recon costs, not just the sticker purchase price.
- Exportable aging buckets you can filter by location, category, or age range without rebuilding formulas each time.
For independent used-vehicle dealers, per-VIN costing changes the clearance math directly. A car that looks like a $2,000 profit opportunity on paper can actually be underwater once transport, reconditioning, and 90 days of floorplan interest are attached to that specific VIN rather than averaged across the lot. Per-VIN cost tracking turns that guesswork into an exact number, and knowing the real number before you discount is what keeps a clearance decision from quietly becoming a loss.
Beyond the math, tools with strong data encryption and guided data import matter because they shorten the gap between “we have a problem” and “we’re acting on it.” A setup that takes days instead of weeks means the aging report is running this month, not next quarter.
How Do You Find the Root Cause Behind Aged Inventory?
Clearing the current batch of aged stock without fixing what caused it just refills the pipeline next quarter. The root-cause process has four steps.
Step 1: Segment by cause category. Pull every 90+ day SKU and tag it: over-ordered, mispriced, poor placement or visibility, wrong-for-market, or seasonal miss. Most operators find one category accounts for the majority of aged dollars.
Step 2: Check the buying decision against actual demand at time of purchase. Compare the quantity or units ordered against the trailing sales rate that existed when the order was placed. Over-ordering relative to real demand, not a forecast, is the most common driver.
Step 3: Audit pricing against comparable live listings or competitor pricing at the time the item started aging, not today. If the item was priced right when it arrived and only became stale after a market shift, that’s a pricing-cadence problem, not a buying problem.
Step 4: Trace the supplier or category pattern. If the same vendor, model year, trim, or product line shows up repeatedly in your 90+ day bucket across multiple cleanup cycles, the fix belongs upstream in your purchasing decisions, not downstream in your clearance tactics.
Document the finding for each root-cause category and revisit it during the next buying cycle. An aging report tells you what’s old. Root-cause analysis tells you why it kept happening, and that’s the difference between clearing stock once and not needing to clear it again next quarter.
How Should Reduction Strategies Connect to Sales Forecasting?
Aged inventory is frequently a forecasting problem wearing a clearance-tactics disguise. If your buying decisions are based on last year’s seasonal pattern, a supplier’s minimum order quantity, or a gut instinct about a hot category, you’ll keep generating aged stock no matter how well you run the clearance ladder afterward.
The fix is a feedback loop, not a bigger spreadsheet. Feed your aging report data directly into next quarter’s purchasing decisions: if a category consistently shows up in your 90+ day bucket, cut the order quantity for that category by the same percentage the aging report shows as unsold, not by an arbitrary round number.
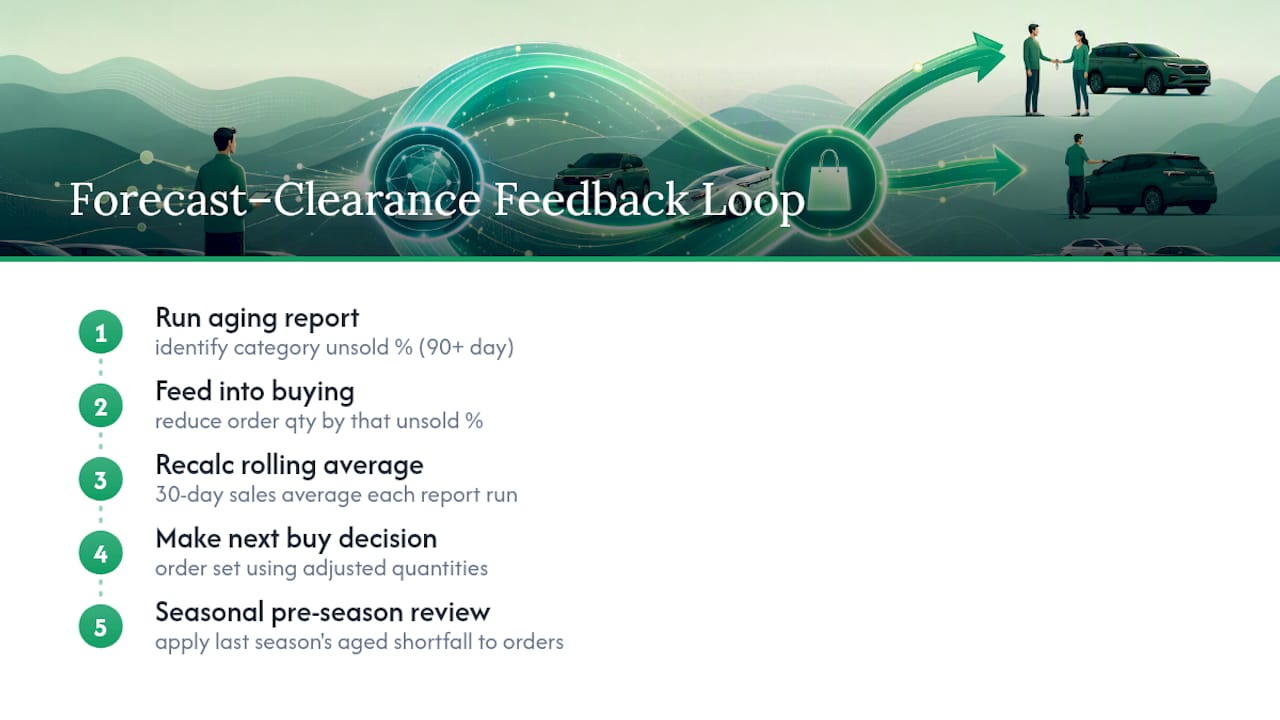
Demand planning also needs a shorter cycle than most operators use. Reviewing forecasts annually or quarterly is too slow to catch a shift; a rolling 30-day sales average, recalculated every time you run the aging report, catches demand changes before they turn into a 90-day aging problem. This is the same rolling-window logic that prevents the year-end write-down scramble in the first place.
For seasonal categories, build the aging review into the pre-season buy meeting specifically. Look at what aged out of last season’s inventory and by how much, then adjust the upcoming order by that exact shortfall. Guessing that “we’ll sell through better this year” without adjusting the number is how the same aged-stock problem repeats on a 12-month loop.
How Do You Prevent Aged Inventory From Coming Back?
The cleanup plan fixes today’s problem. Preventing the next one requires three ongoing habits, run on a fixed schedule rather than when someone notices a problem.
Weekly aging pulse check. A five-minute look at the 61 to 90 day bucket, not the full report, catches items before they cross into the 90+ danger zone where recovery options narrow. This is the single highest-leverage habit in the entire playbook because it acts while bundling and shallow markdowns are still the best available option.
Monthly KPI review against a fixed baseline. Track average days on hand, sell-through rate, and cash recovered from clearance activity against the same targets every month, not against last month’s number. A slow drift, average days on hand rising two days a month, is easy to miss month to month but obvious against a fixed target after a quarter.
Quarterly buying-decision audit. Revisit the root-cause findings from the last cleanup cycle and confirm the purchasing adjustments actually happened. It’s common for a team to identify an over-ordering pattern, agree to fix it, and then repeat the same order quantity next cycle simply because no one checked.
The businesses that keep aged inventory consistently low aren’t the ones with the best clearance tactics. They’re the ones that caught the problem in week six instead of month four, when bundling still worked and a markdown wasn’t yet necessary.
Why Daily Discipline Beats the Annual Write-Down Ritual
Most write-downs happen in December because nobody looked closely in July. The expert consensus on dealer inventory practices is blunt about this: the annual write-down ritual usually signals a lack of daily discipline, not an unavoidable market surprise.
Here’s what that means in practice. If you’re aligning inventory to a rolling 30-day sales average and pricing to move rather than pricing to hold value on paper, you rarely accumulate enough aged stock to need a dramatic year-end correction. The write-down isn’t a failure of accounting. It’s a failure of the twelve months that came before it.
— Eric Dosset
Run Your Aging Reports Without Rebuilding Spreadsheets Every Week
Everything in this guide works with a spreadsheet and enough discipline to update it weekly. Loturn is built for dealers who want that same aging report, turnover math, and clearance decision data without rebuilding formulas every time a car sells or a cost changes.

Loturn assigns cost, transport, and recon expense per VIN automatically, so inventory turn calculations and days-on-hand figures update in real time instead of waiting for a manual export. Per-car profit reporting shows exactly what a unit is worth right now, not what you paid for it three months ago, which is the number you actually need before deciding whether to bundle, markdown, or liquidate. That real-time visibility is what shrinks the 30/90-day cleanup cycle into a weekly habit, and it’s also what cuts down the year-end write-down scramble, since you’re catching aged units in week six instead of month four.
Setup includes free data import from your current system with bank-level encryption on everything you bring over. If you’re ready to see your own aging buckets and per-VIN cost data in one place, check out Loturn’s accounting features and start a trial.
Sources
- Inventory aging report: How to reduce aged stock (Shopify)
- Clearing dead stock without killing margin | Eightx
- How to Calculate Aged Inventory & Reduce Slow-Moving Stock - Novexit
FAQ
What Counts as Aged Inventory?
Most operators define aged inventory as stock sitting unsold past 90 days, though the exact cutoff depends on category speed: fast-moving goods age at 60 days, while big-ticket or seasonal items may not be flagged until 90 to 120 days.
What Does “Aging Inventory” Mean?
Aging inventory refers to stock that is progressively moving further from its receipt date without selling, tracked through buckets like 0 to 30, 31 to 60, 61 to 90, and 90+ days. The term describes the process, while “aged inventory” describes the resulting stock once it crosses your threshold.
How Do You Calculate Aged Inventory?
Calculate individual item age as today’s date minus the receipt date, then calculate average inventory age across your stock using 365 divided by your inventory turnover ratio (COGS divided by average inventory). Tools like Loturn’s inventory turn calculator automate this per unit so you don’t need to rebuild the formula manually each month.
When Should You Write Down Aged Inventory Instead of Discounting It?
Write inventory down when its market value has fallen below cost under the Lower of Cost or Market method and no realistic sales channel would recover more than the current carrying cost. If a markdown, bundle, or outlet channel could still recover more cash than the write-down would preserve, work the clearance ladder first.