
Track five KPI groups and nothing else matters more: inventory turn, cost-to-market ratio, front gross per unit, back-end gross per unit (PVR), and service absorption. Check lead-response and conversion numbers daily, review inventory and gross metrics weekly, and reconcile service absorption and finance penetration monthly. Everything below breaks these into benchmarks, department actions, and a 30/60/90 rollout plan.
TL;DR:
- High inventory turn rates of 12 or more should be maintained, with a focus on weekly reviews of days supply and aging inventory percentages.
- Monitoring cost-to-market ratios of 82 to 88 percent and tracking front gross per unit daily helps identify pricing and deal value trends.
- Daily analysis of lead-to-sale conversion and response times under 15 minutes is critical to optimize sales funnel efficiency.
- Service absorption rates should consistently exceed 70 percent, and fixed operations KPIs require monthly reconciliation for profitability.
- Reliable data health management, including low duplicate and incomplete records, is essential for accurate KPI tracking and should be reviewed monthly.
Table of Contents
- The Dealership KPI Shortlist That Belongs on Every Dashboard
- What Each Department’s Numbers Are Telling You
- Turning KPI Targets Into a Working Dashboard
- Why Bad Data Quietly Wrecks Good KPIs
- Your 30/60/90 Day Rollout Plan
- Service Absorption Deserves Its Own Line on the Scoreboard
- A Lesson From Watching Dealers Chase the Wrong Numbers
- Turn Your Dealership KPIs Into Daily Habits With Loturn
- Sources
- FAQ
The Dealership KPI Shortlist That Belongs on Every Dashboard
Most stores drown in spreadsheets tracking 40 metrics nobody acts on. Top-quartile dealers do the opposite: they run a core dashboard of roughly 15 KPIs and put about 70% of their attention on the ones that predict what happens next, not the ones that just report what already happened. That split between lead indicators (things you can still influence) and lag indicators (things that already happened) is the backbone of a usable scoreboard.
Here’s the list worth building your morning huddle around:
- Inventory turn — units sold ÷ average inventory, annualized. Good: 12. Great: 16+. Lag. Review weekly.
- Days supply — how long current inventory would last at the current sales pace. Target 45 days or fewer for used units. Lead. Review weekly.
- Aging inventory % — share of units over 60 days old. Flag anything above 25%. Lead. Review weekly.
- Cost-to-market ratio — acquisition cost divided by market retail price. Target 82 to 88%, tighter for higher-turn stores. Lead. Review weekly.
- Front gross per unit — gross profit before F&I on each retail deal. Varies widely by market; track your own trend more than a fixed number. Lag. Review daily.
- Back-end gross per unit (PVR) — F&I income per vehicle retailed. Lag. Review weekly.
- Products per deal — F&I products sold per contract. Target 2.0 or higher. Lead. Review weekly.
- Lead-to-sale conversion rate — closed deals ÷ total leads. Lead. Review daily.
- Lead response time — minutes from lead capture to first contact. Under 15 minutes is the standard worth chasing. Lead. Review daily.
- Service absorption — fixed-ops gross ÷ total fixed expenses. Target 70% or higher depending on model. Lag. Review monthly, rolling 12.
- Effective labor rate (ELR) — actual labor revenue collected as a percentage of posted door rate; target around 90% or higher. Lag. Review weekly.
- Hours per repair order (HPR) — average billed hours per RO, typically 1.3 to 1.8 hours. Lag. Review weekly.
- Data health score — duplicate rate plus incomplete-record rate in CRM/DMS. Lead. Review monthly.
Store type changes the math. A high-line used dealer might run tighter cost-to-market with lower turn; a high-volume value store needs faster turn to survive thinner margins per unit.
What Each Department’s Numbers Are Telling You
A KPI that’s slipping is a diagnosis, not just a number. The trick is knowing which lever to pull in which department, and how fast.
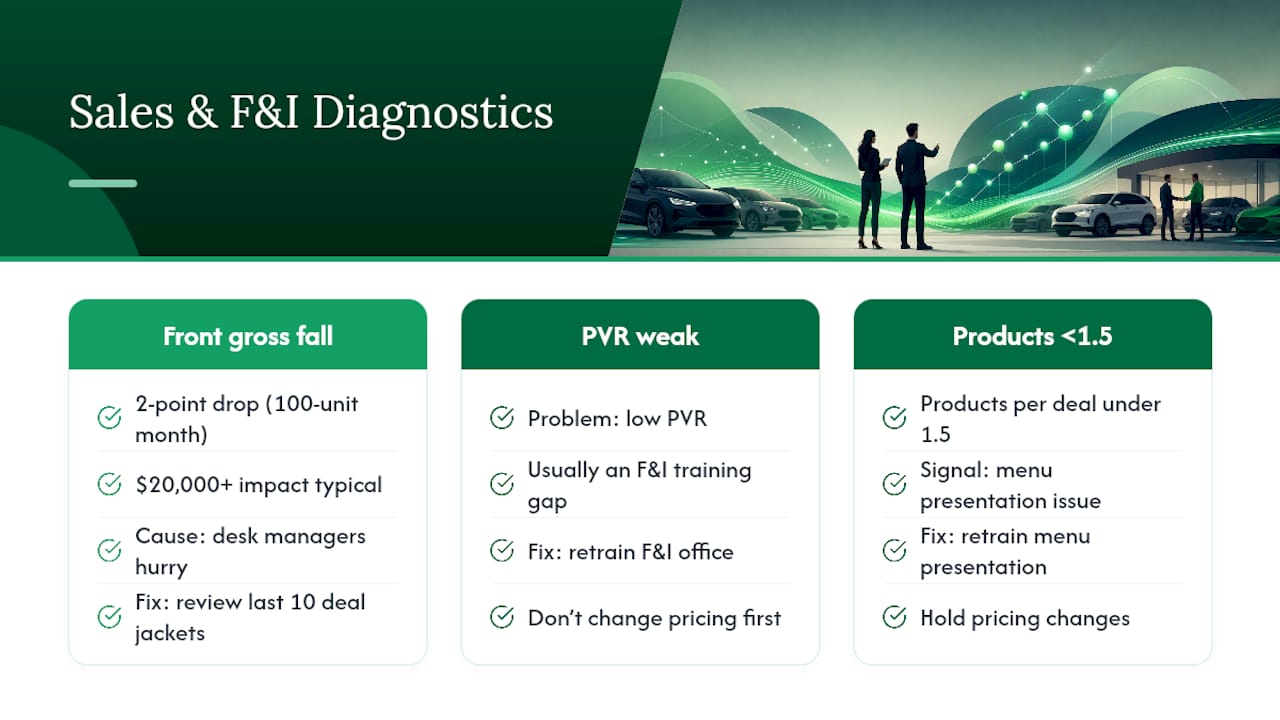
Sales and F&I. When front gross per unit drops two points across a 100-unit month, that’s real money walking out the door, often $20,000 or more depending on your average unit price, and it usually traces back to desk managers negotiating too fast to close volume instead of holding value. The fix starts with a one-on-one review of the last ten deal jackets, not a general memo. PVR trouble is different: it’s almost always a training gap in the F&I office, not a pricing problem. If products per deal falls under 1.5, that’s your signal to retrain menu presentation before you touch pricing at all. A single dealer example from CarDealership.com’s KPI breakdown makes the point well: gross profit per transaction is the one number that reveals both pricing discipline and process consistency in a single glance, which is why elite GMs watch it obsessively while ignoring vanity counts like total leads generated.
Used inventory. Inventory turn and days supply together tell you whether you’re buying right. If days supply creeps past 60 while turn falls under 10, you’re not moving fast enough to avoid depreciation eating your margin. The corrective sequence is always the same: price drop first on units over 45 days, then prioritize recon on units close to retail-ready, then redirect ad spend toward the units actually sitting.
Fixed operations. Low ELR usually means advisors are discounting labor informally or not writing complete estimates. Low hours per RO often means techs are underselling multi-point inspection findings, not that the shop lacks work. Voltra’s dashboard benchmark data puts a stable shop’s absorption target at 70% or higher, and that gap between 60% and 70% is usually the difference between fixed ops subsidizing the store or draining it.
Turning KPI Targets Into a Working Dashboard
Setting a target only matters if you know what a point of movement is actually worth. A one-point increase in PVR at a 100-unit-per-month store is roughly $100 per unit times 100 units, or about $1,200 a month, every month, once the habit sticks. That math is what makes coaching conversations concrete instead of abstract.
Each KPI has a natural home system, and building a dashboard means wiring these together instead of copying numbers by hand:
- DMS feeds unit counts, gross profit, and inventory aging.
- CRM feeds lead response time and lead-to-sale conversion.
- F&I platform feeds PVR and products per deal.
- Service DMS feeds ELR and hours per RO.
- Accounting system feeds service absorption and overhead allocation.
Refresh cadence should match how fast the KPI can change: lead metrics in real time or daily, inventory checks every 48 hours, fixed-ops numbers weekly, and full financial reconciliation monthly. A per-car profit tracking system that assigns cost by VIN as soon as a bill posts removes most of the lag between “something changed” and “you noticed.”
Pro Tip: *Build alert thresholds, not just snapshot numbers. A dashboard that only shows today’s inventory turn is a report card.
Why Bad Data Quietly Wrecks Good KPIs
A KPI is only as good as the record behind it. Duplicate customer records, incomplete lead attribution, and missing cost entries corrupt conversion rates and gross figures without anyone noticing until the trend is already ugly. AutoAlert’s research on dealership metrics treats data health as its own KPI category for exactly this reason.
Three indicators worth watching monthly:
- Duplicate rate — percentage of CRM records that represent the same customer twice.
- Incomplete records — leads or deals missing a phone number, source, or cost field.
- Lead attribution accuracy — spot-check a sample against actual ad platform or call-tracking data.
Vendor oversight isn’t optional paperwork. The FTC’s Safeguards Rule requires dealers to run risk assessments on any vendor touching customer data and reassess that risk periodically, not just sign a contract once and move on. Demand data portability, uptime SLAs, and a quarterly business review clause before you sign with any CRM or lead-source vendor.
Data health and lead-to-sale conversion move together. When duplicate rates and incomplete records climb, conversion rates fall in the same reporting period, which is the clearest sign your funnel problem is actually a data problem.
Your 30/60/90 Day Rollout Plan
Rolling out a KPI program in a single month is a fantasy. Spread it over a quarter and it sticks.
- Days 1 to 30: Pick your core KPI list, assign an accountable owner to each (not a department, a person), map every KPI to its data source, and start daily huddles with a printed or projected scoreboard.
- Days 31 to 60: Automate feeds into one dashboard, lock in targets by department, launch weekly coaching cycles tied to the numbers, and start enforcing vendor SLAs on data quality.
- Days 61 to 90: Tie manager and desk incentives to KPI improvement, run a full pre/post P&L comparison, and refine dashboard alert thresholds based on what actually moved.
A simple ownership template helps: KPI: Lead response time. Owner: BDC manager. Corrective action if it slips past 20 minutes: retrain on the auto-response script and audit call routing that week.
Pro Tip: Don’t wait until day 90 to check if the plan is working. Pull a mini P&L comparison at day 45 against your baseline month. If nothing moved, the problem is usually ownership, not the KPI itself.
Service Absorption Deserves Its Own Line on the Scoreboard
Service absorption is the clearest test of whether fixed ops can cover the store’s overhead without new-car or used-car gross bailing it out. The formula is simple: service and parts gross divided by total fixed expenses. Track it monthly and on a rolling 12-month basis to smooth out warranty timing and seasonal swings, and treat anything consistently under 70% as a signal to raise parts pricing, push customer-pay penetration, and run retention campaigns.
A Lesson From Watching Dealers Chase the Wrong Numbers
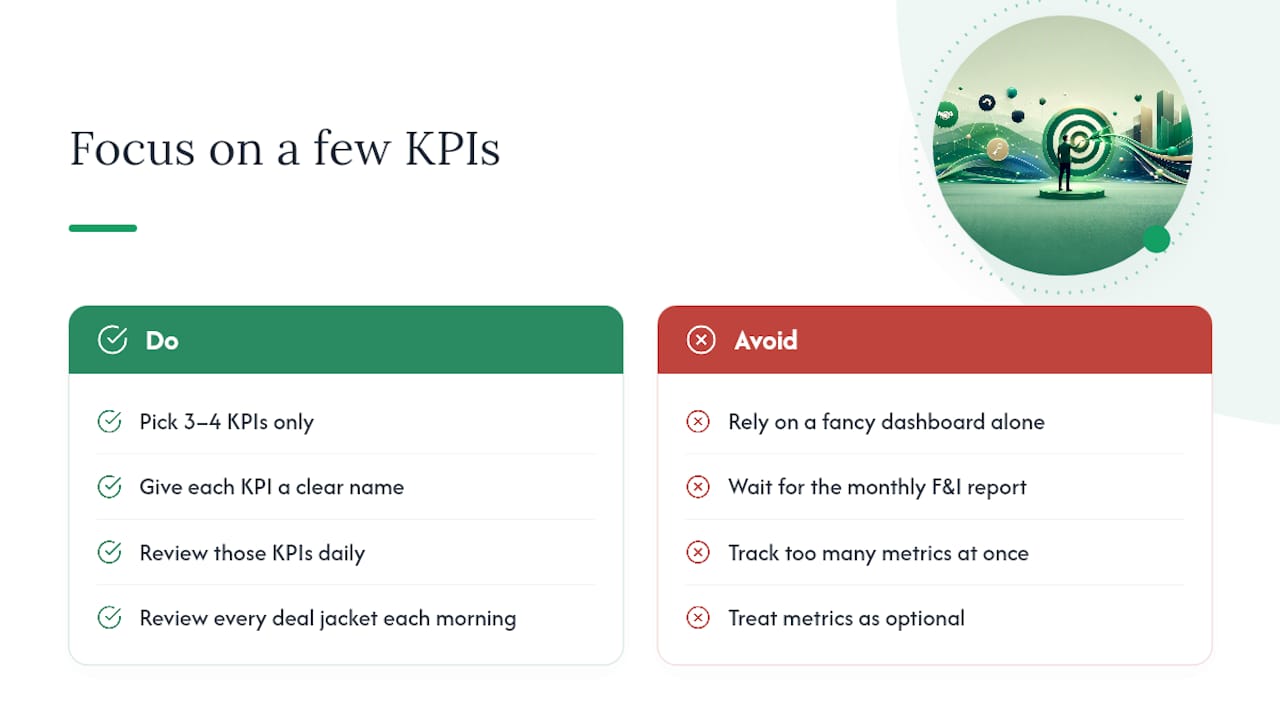
The dealers who improve fastest aren’t the ones with the fanciest dashboard. They’re the ones who pick three or four KPIs, assign a name to each, and check them daily until the habit is automatic. One independent dealer’s PVR climbed steadily after the general manager started reviewing every deal jacket each morning instead of waiting for the monthly F&I report. Consistency beat sophistication.
That’s the same discipline behind tools built specifically to surface per-car profit in real time rather than after the month closes.
— Eric Dosset
Turn Your Dealership KPIs Into Daily Habits With Loturn
Loturn is the platform that turns the KPI shortlist above into numbers you actually see, not a spreadsheet you rebuild every Friday. It assigns cost by VIN the moment a bill posts, so front gross, back-end gross, and true per-car profit stay current instead of estimated. Inventory turn calculates automatically from live cost and sales data instead of a manual formula someone forgets to update.
Setup includes free data import from your current system, and every account runs on bank-level encryption, which matters given the vendor-oversight obligations covered above. Dealers who switch typically report faster month-end reconciliation and far more confidence in what a given deal actually made. If you’re ready to see real per-car numbers instead of guessing, start with Loturn’s accounting features or book a walkthrough at Loturn.
Sources
- Understanding service absorption — MyKaarma
- The Dealership KPI Dashboard: 15 Metrics, Benchmarks, and a Free Calculator for 2026 — Voltra
FAQ
What are the 5 key dealership KPIs to track first?
Inventory turn, cost-to-market ratio, front gross per unit, back-end gross per unit (PVR), and service absorption form the core group every general manager should review weekly at minimum.
What are the top KPIs in dealership sales specifically?
Lead-to-sale conversion rate, lead response time, front gross per unit, and products per deal drive most of the variance in sales department performance.
What are the top 3 KPIs for a used-car dealership?
Inventory turn, cost-to-market ratio, and aging inventory percentage together reveal whether buying discipline and pricing strategy are working.
How often should dealership KPIs be reviewed?
Lead-related KPIs like response time and conversion need daily review, inventory and gross metrics work well on a weekly cycle, and service absorption should be checked monthly on a rolling 12-month basis.
How does Loturn help track dealership KPIs?
Loturn assigns cost by VIN in real time, which keeps inventory turn, front gross, and true per-car profit current without manual spreadsheet updates.